What is a Benchmark Tool and Why Do I Need One?

If you have ever wondered whether your server is actually as fast as the spec sheet claims, whether a code change made things better or quietly made them worse, or whether you are getting your money's worth from your infrastructure, then you have already encountered the problem that benchmark tools exist to solve.
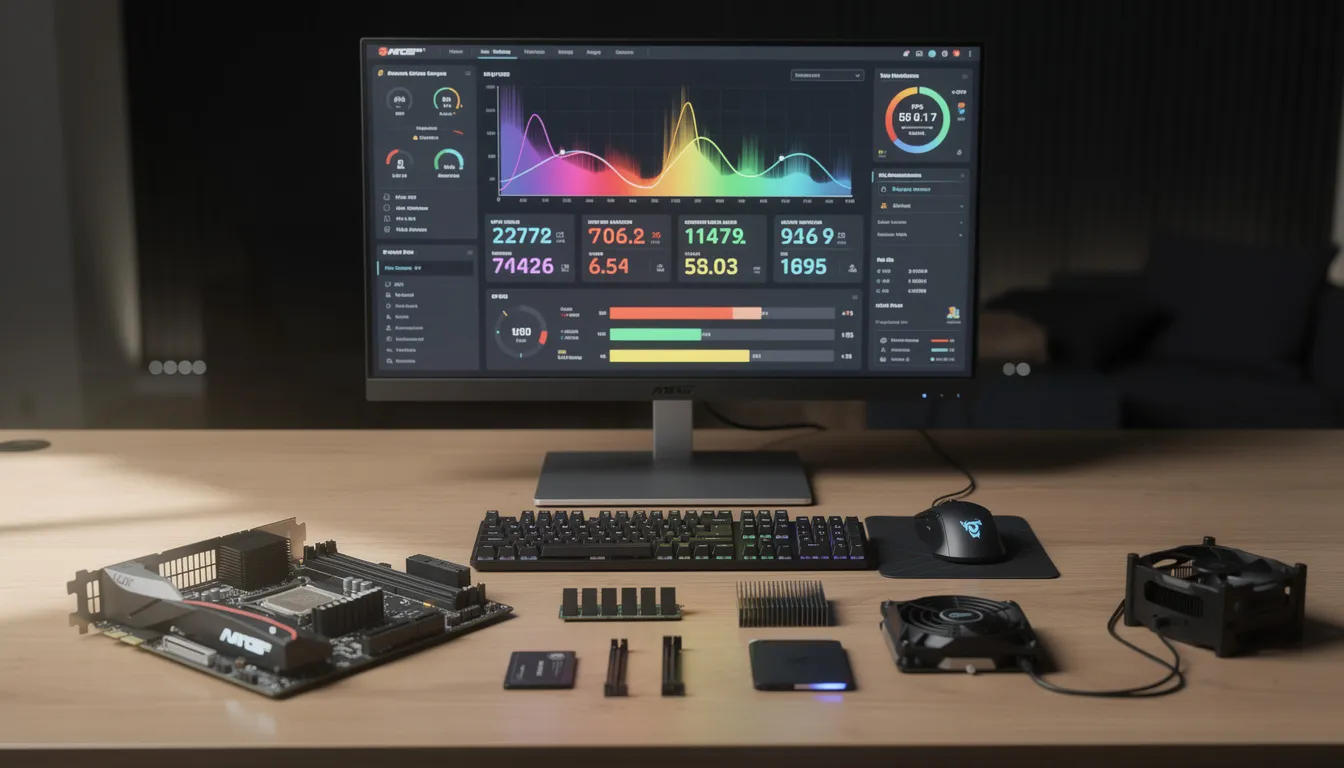
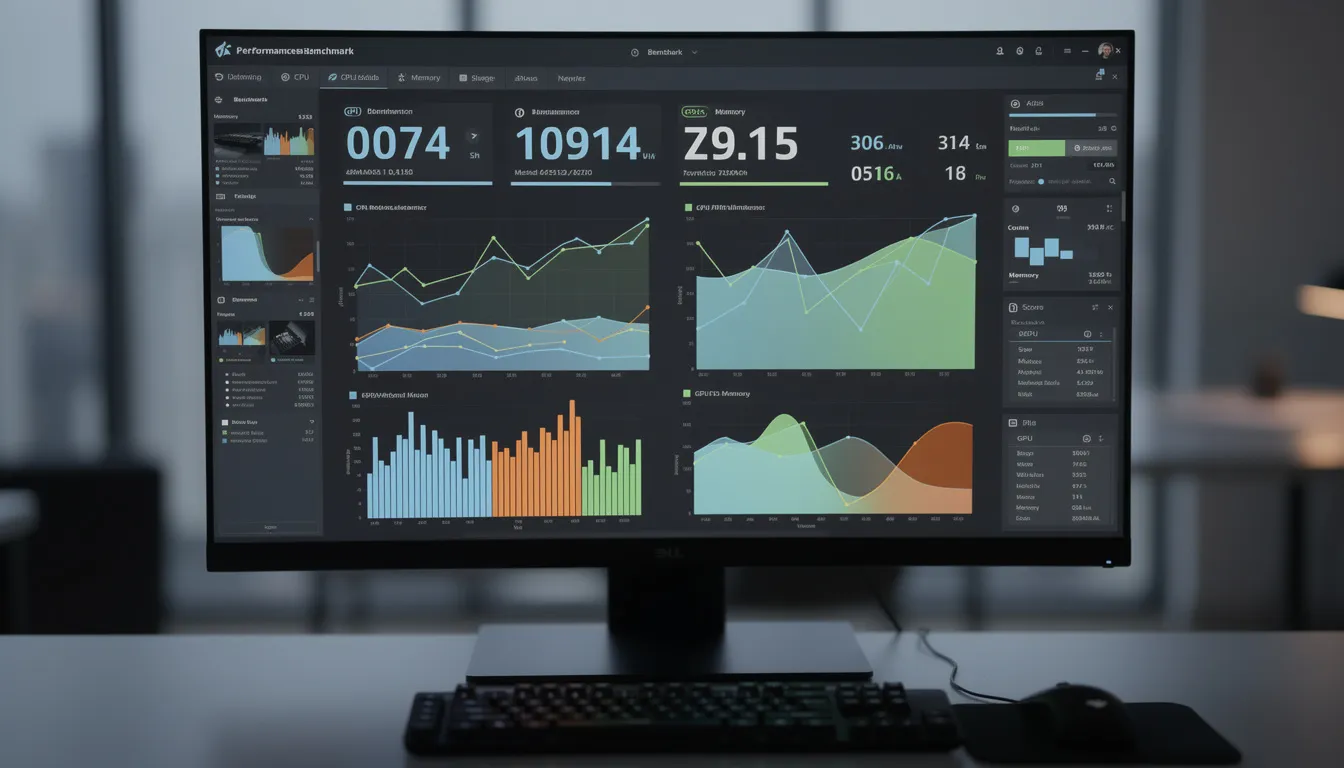
A benchmark tool is software designed to measure and evaluate your computer hardware output through standardized tests. They create controlled conditions where your CPU, graphics card, RAM, and storage complete specific tasks, then generate scores that you can compare against other systems or use to track improvements over time.
These tools matter for three practical reasons: hardware optimization (finding bottlenecks and confirming tweaks actually improve results), troubleshooting (identifying failing or underperforming parts), and purchasing decisions (comparing real-world data before buying new hardware).
This guide covers PC performance testing software for Windows, Linux, and Mac platforms, focusing on tools that measure hardware capabilities. It doesn't cover network speed testing utilities. The target audience includes PC enthusiasts, gamers optimizing their rigs, IT professionals evaluating hardware, and anyone trying to determine whether their components perform as expected.
Direct answer: Benchmark tools are software applications that test and measure computer hardware through standardized, repeatable tests. They provide numerical scores and data that let you compare your output or track your own PC performance.
By the end of this guide, you will:
- Understand the different types of benchmark tools and what each measures.
- Know which software to choose for CPU tests, GPU performance, or overall system evaluation.
- Learn how to run benchmarks correctly and interpret results.
- Troubleshoot common issues revealed by testing.
- Compare your hardware against community databases.
Hardware testing categories
CPU benchmarks evaluate hardware capability across single-threaded and multi-threaded workloads. These tests measure clock speeds, core utilization, and the processor’s ability to handle tasks like rendering and machine learning calculations.
Your CPU benchmark results directly connect to overall system performance because the processor handles calculations for virtually every computing task. Strong CPU test scores indicate faster application responsiveness, quicker file operations, and better outputs in productivity software.
Synthetic vs real-world benchmarks
Synthetic benchmarks apply artificially controlled tests designed to stress specific parts in predictable ways. They produce consistent, comparable scores but may not reflect how your system handles actual applications.
Real-world benchmarks test systems under typical workloads—rendering actual 3D scenes or processing genuine files. These tests provide practical indicators but introduce more variables that can affect score consistency.
Understanding this distinction helps you choose appropriate tools: synthetic benchmarks work best for hardware comparisons and stability testing, while real-world benchmarks better predict actual usage experience.
Popular benchmark software options
Building on the testing categories above, let’s examine the best software options for measuring CPU, GPU, and overall system performance. Each serves different purposes and supports various platforms.
3DMark for gaming performance
3DMark stands as the industry standard for gaming benchmarks and GPU tests. The software includes multiple test suites: Time Spy measures DirectX 12 performance, Fire Strike tests DirectX 11 capabilities, and Port Royal evaluates ray tracing output on compatible graphics cards.
The tool runs graphics tests that simulate gaming workloads across various quality levels. It supports cross-platform benchmark comparisons, including Windows, Android devices, and iOS mobile devices. Your scores upload to an online database where you can compare results against other users running identical configurations.
Cinebench for CPU testing
Cinebench evaluates CPU performance using real-world rendering workloads from Maxon’s Cinema 4D software. The benchmark measures both single-core and multi-core processor capabilities, providing separate scores for each.
This tool connects directly to practical applications: your Cinebench score correlates with capabilities in 3D rendering, video editing, and other processor-intensive creative work. The software runs on Windows, macOS, and Linux, making it valuable for users across different operating systems who need reliable CPU data.
UserBenchmark for all-in-one testing
UserBenchmark tests all major hardware components—CPU, GPU, memory, and storage—in a single free benchmark suite. The software generates a comprehensive report and compares your results against a massive database.
You can quickly determine how each part performs, and identify whether any underperform expectations. This tool works on Windows and provides particularly useful data for users building a new PC or diagnosing system issues.
Key points on benchmark software:
- Free options exist for every testing category.
- Paid versions typically offer more detailed analysis and additional test modes.
- Cross-platform support varies—verify compatibility with your operating systems.
Choosing and running benchmark tests
Once you have selected your benchmarking software, the integrity of your testing hinges on two factors: the tools you choose and the environment you maintain. Your methodology determines whether your results reveal the true potential of your equipment or are skewed by inconsistent variables.
Benchmark selection process
Different goals require different benchmark tools. Match your testing purpose to the appropriate software:
- Identify your testing goals: Gaming performance evaluation calls for 3DMark’s graphics tests, while content creation workflows benefit from Cinebench CPU scores. Users wanting overall system assessment should start with UserBenchmark.
- Select appropriate benchmark software for your hardware: Verify your graphics card supports required features (ray tracing benchmarks need RTX or equivalent hardware). Confirm operating system compatibility and download the current version.
- Close background applications and ensure stable system conditions: Shut down browsers, streaming software, and system utilities. Disable automatic updates temporarily. Ensure adequate cooling and let the computer reach idle temperatures before testing.
- Run multiple test iterations for consistent results: Single runs can produce anomalies. Running three or more tests and averaging results provides more reliable numbers. You can watch your temperatures and clock speeds during runs using hardware monitoring like MSI Afterburner.
Benchmark comparison table
| Tool | Best For | Platform Support | Cost |
|---|---|---|---|
| 3DMark | Gaming GPUs, ray tracing | Windows, Android, iOS | Free/paid |
| Cinebench | CPU capability, rendering | Windows, macOS, Linux | Free |
| UserBenchmark | Overall system evaluation | Windows | Free |
| Geekbench | Cross-platform CPU/GPU | Windows, macOS, Linux, Android, iOS | Free/paid |
| PCMark | Productivity workloads | Windows | Free/paid |
Common challenges and solutions
Benchmark testing presents several recurring issues that can skew results or confuse interpretation. Addressing these problems ensures your data accurately reflects your computer's capabilities.
Inconsistent benchmark results
Score variations between runs often indicate background processes, thermal issues, or unstable system conditions. Prepare your system by closing all unnecessary applications, disabling antivirus real-time scanning temporarily, and ensuring your computer has been idle for several minutes before testing. Run at least three benchmark iterations and discard any obvious outliers before averaging.
Hardware thermal throttling during tests
When GPU or CPU temperatures exceed safe limits, your computer reduces clock speeds to prevent damage, which artificially lowers your benchmark scores. Track temperatures during tests. If throttling occurs, improve case airflow, clean dust from heatsinks, verify fan speeds, or consider aftermarket cooling solutions. Testing in cooler ambient conditions can also help establish maximum baselines.
Interpreting benchmark scores
Raw numbers mean little without context. Always compare your scores against the same benchmark version and test settings. Use the software’s built-in comparison databases to see where your computer ranks against identical setups. Remember that percentile rankings show relative standing among other users—a 75th percentile result means you outperform 75% of systems with similar setups, not that you’ve achieved 75% of maximum possible output.
Conclusion and next steps
Benchmark tools provide measurable, comparable data that removes the guesswork from your evaluation. To get started:
- Download software matching your primary use case.
- Run baseline tests on your current setup with proper preparation.
- Compare results against community databases to understand your relative outputs.
- Save your baseline scores to track changes after future upgrades or optimization attempts.
Additional resources
Official benchmark software:- 3DMark: Comprehensive GPU tests including Time Spy, Fire Strike, and Port Royal
- Cinebench: Industry-standard CPU rendering benchmark
- Geekbench: Cross-platform CPU and compute benchmark
- UserBenchmark: Free all-in-one system testing
- MSI Afterburner: GPU monitoring, temperatures, and fan control
- HWiNFO: Detailed sensor data across all components
- CPU-Z/GPU-Z: Output specifications and real-time monitoring
![17 Maven Commands and Options [Cheat Sheet]](/static_content/vpsserver_com_frontend/img/maven-commands.png)
.png)