Prometheus is a systems monitoring and alerting toolkit originally built at SoundCloud. It records real-time application metrics in an in-built time-series database via a query language, PromQL. Prometheus scrapes and stores metric data to create a flexible and powerful alerting and visualization system, such as in network monitoring and alerting tools like Grafana.
-
- Importance of Network Monitoring
- Overview of Prometheus Monitoring System
- Development and Key Milestones
- Why Choose Prometheus for Network Monitoring?
- Prometheus Components
- How Prometheus Works
- Setting Up Prometheus
- Integrating Prometheus with Grafana
- Use Cases of Prometheus Monitoring System
- Pros and Cons of Using Prometheus
- Prometheus Monitoring and Alerting on VPSServer
Importance of Network Monitoring
Network monitoring is one critical aspect of maintaining IT infrastructure health and performance. Organizations can detect and rectify problems before they affect users, ensuring that services are available and reliable. Good network monitoring also enables balancing resource usage, preventive measures to avoid downtime, and early anomaly detection that helps security.
Overview of Prometheus Monitoring System
Prometheus is a substantial data collection tool, and its querying capabilities in network monitoring have built it. It supports several exporters that collect the metrics for networking devices and other remote services, providing unified visibility over the network's extensive infrastructure. With Prometheus, deep dashboard and alert configurations can be achieved to monitor parameters such as performance, latency, traffic, and all other critical network indicators that might impact the efficiency and performance of smooth network operations.
Development and Key Milestones
Prometheus was built in 2012 by SoundCloud engineers searching for a mature monitoring solution for cloud-native environments that could scale. SoundCloud developers were frustrated with what was available then: existing solutions could not address the coverage problems in such dynamic cloud environments. They created Prometheus to address the challenges of monitoring dynamic cloud environments.
Since the outset, Prometheus has accomplished several essential achievements:
2015: Open-sourced under Apache 2 License.
2016: Joined the Cloud Native Computing Foundation (CNCF) as the second hosted project following Kubernetes.
2018: Became the first CNCF Graduated Project reflecting maturity and wide adoption.
Why Choose Prometheus for Network Monitoring?
Key Features of Prometheus
Prometheus offers several key features for network monitoring:
Scalability
Prometheus has been engineered to efficiently manage millions of time-series metrics, ensuring its performance is maintained without degradation as your network scales from small to large.
Flexibility
Multiple exporters support Prometheus and help collect metrics from various network devices and services. This flexible open-source monitoring allows one to monitor hardware and software comprehensively at almost every infrastructure level.
Real-Time Monitoring
With a solid data collection network, distributed storage, and querying capabilities, Prometheus excels at providing real-time insights. Accordingly, it allows users to detect and react to incidents on time, thus reducing downtime and increasing general reliability across the network.
Open Source
Being a free, open-source project, Prometheus has a great community and contributors, resulting in constant changes, improvements, and regular updates—much more than I can do here. Hence, it can be a reliable choice for long-term monitoring.

Unique Features
Time Series Data Collection
It records Prometheus metrics in a time series data and database; it helps monitor the historical view and detailed tracking of metrics to understand trends and patterns important for the network's long-term health.
PromQL
PromQL is a powerful query language that allows for complex querying and data analysis. Therefore, PromQL can make it possible to conduct advanced searches and develop elaborate reports. This eases the process of gaining insights to act on from your data.
Alerting System
Prometheus has an alerting system that allows threshold-based alerting rules to be defined. It is a proactive alerting system in which potential issues can be detected in time, and actions will be taken promptly to maintain stability and performance on your network.
Multi-Dimensional Data Model
Prometheus allows you to tag metrics with optional key-value pairs using a Multi-Dimensional Data Model. Tagging allows us to monitor at the most granular level, getting exact insights into detailed parts of the network by slicing and dicing data in many dimensions.
Prometheus Components
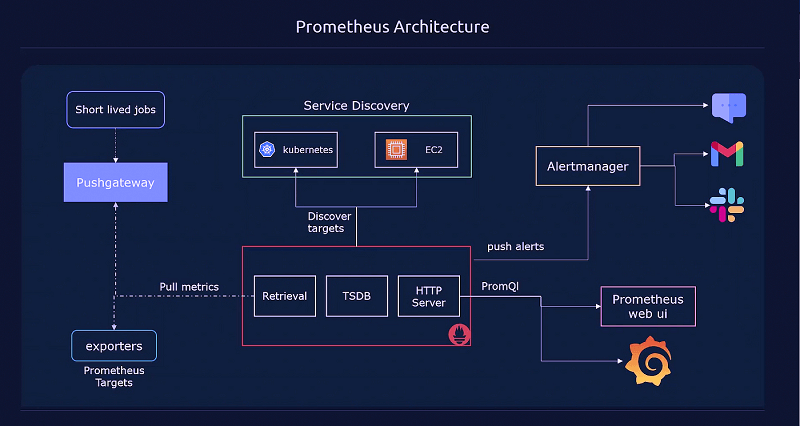
Prometheus Server
The Prometheus server is at the core of the entire ecosystem, scraping and collecting metrics from the endpoints configured. These endpoints are usually services or exporters instrumented to provide metrics to remote services. The server processes queries and generates real-time insights from the collected data.
Data Storage
Prometheus uses a custom time series database to store metrics efficiently by timestamp, labels, and metric names. This allows for fast queries and minimal data storage overhead, making it scalable and reliable for various data retention needs.
Exporters
Exporters collect metrics from various systems and expose them in a format Prometheus can scrape. They enable the monitoring of various applications, distributed systems, and other infrastructure components, providing comprehensive visibility into your environment.
Alertmanager
The Alertmanager manages alerts generated by Prometheus, handling deduplication, grouping, and routing to notification channels. It ensures timely and organized alerting, helping teams respond quickly to potential issues.
Pushgateway
The Pushgateway collects metrics from short-lived jobs that Prometheus cannot directly scrape. These jobs push their metrics to the Pushgateway, making them available for Prometheus to scrape, ensuring effective process monitoring.
How Prometheus Works
Prometheus operates on a pull-based model, periodically scraping metrics from configured endpoints. The basic workflow is as follows:
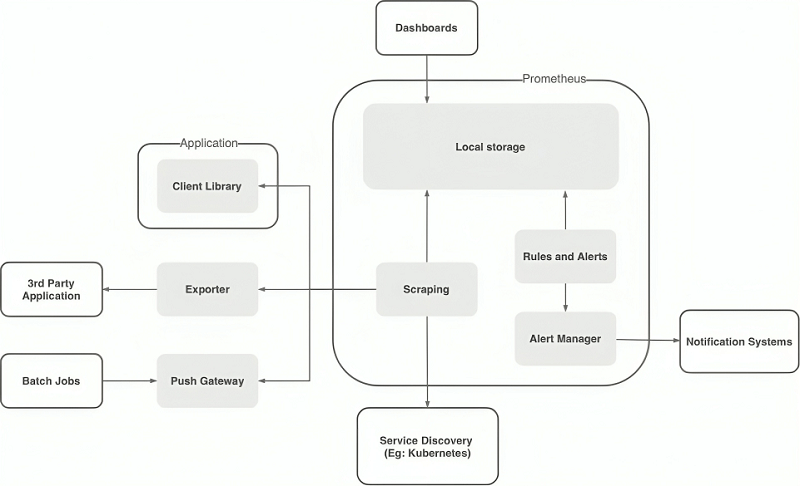
Scraping
The Prometheus servers regularly scrape metrics from the HTTP endpoint, typically provided by exporters or instrumented services.
Storing
The scraped metrics are then stored in the time series database and indexed by the timestamp, labels, and metric name to provide adequate access to data for analysis.
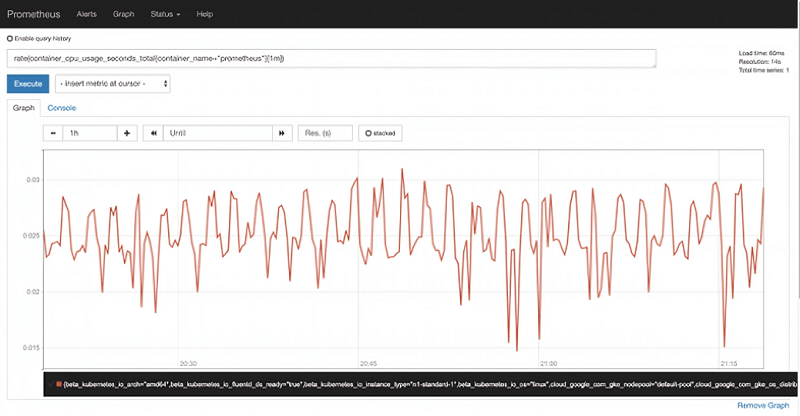
Querying
PromQL, the potent Prometheus query language, allows users to query the stored data to extract insights and generate reports.
Alerting
Based on defined rules, Prometheus can evaluate data and send alerts to the alert manager for notification, ensuring proactive monitoring.
Setting Up Prometheus

System Requirements
Prometheus has specific operating system requirements for optimal performance. It works on Unix-based systems like Linux and macOS. It requires a minimum of 2GB RAM, with SSD storage recommended for efficient data handling and faster queries. A multi-core CPU ensures smooth operation, especially during heavy loads, making Prometheus effective for diverse network monitoring tasks.
Installation
To install Prometheus, first download the latest release from the official website. Once downloaded, extract the files from the archive and send them to the desired location on your system. Finally, run the Prometheus binary, specifying the configuration file with the appropriate flag to start the server. This process quickly gets Prometheus up and running, ready to begin monitoring your network.
Basic Configuration
Configuring Prometheus involves setting up the `prometheus.yml` file. Key settings include:
Define global settings, such as scrape and evaluation intervals, to control how often data is collected and analyzed. Define Scrape Configurations, specify targets to scrape and indicate which endpoints Prometheus should collect metrics from.
For example, you might configure Prometheus to scrape itself on single server nodes and have a node exporter run on your local machine. These configurations ensure where and how often to scrape Prometheus metrics, which form the backbone of your monitoring setup.
Integrating Prometheus with Grafana
An Introduction to Grafana
Grafana, an open-source observability and monitoring platform, is used worldwide to represent time series data. It provides access to intuitive, insightful, and exciting dashboards that help one interpret and analyze the metrics.
Advantages of Integration
Advanced Visualization: Grafana offers advanced graphing and allows users to create insightful, interactive dashboards, making it simple to visualize Prometheus metrics.
Custom Dashboards: Users can design multiple modes of dashboards to their liking for a personalized view, all in sync with specific monitoring needs.
Alerts and Notifications: Another added advantage of Grafana is its capability to manage alerts and notifications.
It complements the alerts feature within Prometheus but in a friendlier user interface. This integration ensures that data collected in Prometheus is provided with end-to-end monitoring solutions, together with powerful visualization tools offered by Grafana.
Use Cases of Prometheus Monitoring System
Real-World Examples
Industries currently use the Prometheus monitoring system to monitor network performance and health. In the technology industry, for instance, companies use Prometheus to monitor server performance and send an alert if an anomaly is detected, maintaining high service availability to their customers. Internet service providers monitor bandwidth usage and maintain ideal service delivery with minimal packet loss.
Case Study
One of the big e-commerce platforms is known to use Prometheus to monitor its colossal infrastructure. Prometheus's real-time metrics and alerting system have significantly reduced system downtime and are more reliable for high-traffic events, such as sales promotions.
Industry Adoption
These days, different applications use Prometheus: finance, health, and telecommunications. Companies in these sectors rely on Prometheus for its scalability, flexibility, and robustness in the provided alerting features, keeping their networks performant and reliable under different loads and specified conditions.
Pros and Cons of Using Prometheus
Pros: Prometheus is scalable and effectively processes large metric volumes. Its flexibility to host a wide range of exporters means it has extensive monitoring capabilities. It captures real-time insights and raises alerts quickly for prompt problem detection. It is an open-source, free project; a large community constantly improves and supports the software.
Limitations: Prometheus can be complicated to set up and configure, especially in large-scale environments. Proper storage management must also be in place to keep data for various long-term storage uses. Further development could involve improving documentation and integrating it with other third party tools, which would help ease its use and make it more versatile.
Prometheus Monitoring and Alerting on VPSServer
Prometheus is excellent software for supervising environments such as VPSServer and a platform for providing very high-performance VPSs. This integration with VPSServer will provide the user with greater detail regarding the performance and health of the VPS instances.
Prometheus will effectively scrape metrics on CPU usage, memory consumption, disk I/O, and network traffic for real-time data and alerts. In this regard, Prometheus's flexibility and scalability are further increased, and it is more well-suited for dynamic VPS environments that will ensure reliable monitoring as the VPS infrastructure grows.
Conclusion
Prometheus is a versatile network monitoring tool known for its time-series data collection and scalability. Its modular architecture ensures adaptability with multiple components, like the Prometheus server and Alertmanager. Despite some setup complexity, Prometheus offers significant benefits in monitoring efficiency and proactive alerting. Integrating Prometheus with platforms like VPSServer enhances performance insights, making it an invaluable asset for maintaining network reliability and performance across various environments.
Frequently Asked Questions
Can Prometheus monitor non-HTTP endpoints?
Yes, Prometheus can monitor non-HTTP endpoints using Exporters. Exporters convert metrics data from different systems (such as databases, messaging queues, or custom applications) into a format Prometheus can scrape, enabling monitoring of diverse systems beyond HTTP services.
Can Prometheus monitor resources on VPSServer instances?
Of course. In VPSServer instances, one can effectively monitor resources with Prometheus. By setting up the Prometheus Exporters on the VPS Server instances, users can collect and monitor CPU usage, memory consumption, disk I/O, and network traffic for maximal performance and resource utilization.
What are some standard Prometheus metrics types?
Gauges, summaries, histograms, and counters are Prometheus metric types commonly used to capture various elements of your system's performance and behaviour.
Is Prometheus suitable for large-scale environments?
Yes, it is designed to be highly scalable and can efficiently handle large volumes of metrics data. Prometheus supports a distributed system, allowing users to scale horizontally as their monitoring needs grow.
What does service discovery mean in Prometheus?
In Prometheus, service discovery is the automated procedure for dynamically finding and tracking instances of targets or services. Service discovery allows Prometheus to regularly see and add new targets, eliminating old ones to guarantee thorough and current infrastructure monitoring.

Bilal Mohammed is a SOC analyst and cybersecurity expert who is passionate about making the internet safer. He has expertise in penetration testing, networking, network security, web development, and security operations center (SOC) services. In his spare time, he looks for security and design vulnerabilities to protect against attacks from hackers.