Have you ever wondered how much memory is available on your Linux system? If you do, you're not alone.
Linux's memory usage is low compared to other operating systems. However, it doesn't offer an intuitive way to check memory. And that's why, in this article, we'll learn five ways to check memory usage in Linux.
We'll cover a detailed explanation of each Command and how to read the results. It'll help sysadmins and developers to use these tools to manage system memory confidently.
For this tutorial, we're going to use Ubuntu 22.04.1 LTS. You can still follow the guide using any other Linux distribution, as these command line tools work on all Linux distributions.
To follow the guide, you must have the following:
-
Access to a Linux user account with sudo privileges.
-
Access to a terminal or command line interface
-
Ability to install new packages, such as access to the APT package manager
Let's get started.
-
- Why do you need to learn about Memory usage in Linux?
- cat Command to Show Linux Memory Usage
- free Command to see free and used memory in Linux
- vmstat Command to Report Virtual Memory Statistics in Linux system
- top Command to Check Memory Use
- htop Command to Find the Memory Load of Each Process
- Bonus: GNOME Desktop: GUI tool to see memory usage
- Conclusion
Why do you need to learn about Memory usage in Linux?
Before we start, it is essential to learn about memory usage. In other words, does the knowledge of free and used memory matter?
Each time you run a process, it consumes Random Access Memory(RAM). Without RAM, a program will not function. So, if you try to run a process that requires more memory than is currently available, it won't run. Also, running processes in Linux changes memory usage based on users' actions. If the user tries to do an action, but the system cannot allocate it, it can crash or show an error. All of these become important if you're running a low-spec machine.
Sysadmins must also learn about system memory to optimize it for the best performance. This way, they can learn about rouge apps that slow down the whole system by clogging system memory. This can block new applications or even crucial Linux kernel processes.
In addition, you can use memory usage in Linux commands to learn about the total physical memory installed on the system. It also provides information about Linux swap partitions, including other vital system info.
On the other hand, web admins can also use these tools to check memory usage in their Linux servers. This way, they can learn whether the server can handle site visitors during peak hours. If memory usage is too high, you can always add more physical memory to handle peak traffic.
In short, keeping a tab on memory usage in Linux (check our Linux Basic Commands) lets you troubleshoot issues with your system. After all, the Linux system depends on memory and how it is utilized. So, if you're a sysadmin or a developer, you need to know the exact amount of free and used memory alongside the server's swap memory, kernel's caches, and buffers.
cat Command to Show Linux Memory Usage
The cat command on Linux lets you read data from files and provides output to the terminal. Here, the cat command stands for Concatenate.
On the other hand, Linux stores all the memory usage information in the /proc/meminfo file.
So, we can combine both of them to reveal information about available and used memory.
To do so, run the Command below:
copycat /proc/meminfo
It'll output the real-time system's memory usage. Moreover, it'll also list the shared memory usage in Linux. If you're looking for buffers' info, you'll also get it here.
copycat /proc/meminfo
#output
MemTotal: 8090732 kB
MemFree: 7642496 kB
MemAvailable: 7583008 kB
Buffers: 5912 kB
Cached: 119512 kB
SwapCached: 0 kB
Active: 20964 kB
Inactive: 141668 kB
Active(anon): 1812 kB
Inactive(anon): 37632 kB
Active(file): 19152 kB
Inactive(file): 104036 kB
Unevictable: 0 kB
Mlocked: 0 kB
SwapTotal: 2097152 kB
SwapFree: 2097152 kB
Dirty: 0 kB
Writeback: 0 kB
AnonPages: 37208 kB
Mapped: 63220 kB
Shmem: 2236 kB
KReclaimable: 21148 kB
Slab: 67344 kB
SReclaimable: 21148 kB
SUnreclaim: 46196 kB
KernelStack: 3184 kB
PageTables: 1216 kB
NFS_Unstable: 0 kB
Bounce: 0 kB
WritebackTmp: 0 kB
CommitLimit: 6142516 kB
Committed_AS: 390148 kB
VmallocTotal: 34359738367 kB
VmallocUsed: 23376 kB
VmallocChunk: 0 kB
Percpu: 4352 kB
AnonHugePages: 14336 kB
ShmemHugePages: 0 kB
ShmemPmdMapped: 0 kB
FileHugePages: 0 kB
FilePmdMapped: 0 kB
HugePages_Total: 0
HugePages_Free: 0
HugePages_Rsvd: 0
HugePages_Surp: 0
Hugepagesize: 2048 kB
Hugetlb: 0 kB
DirectMap4k: 19456 kB
DirectMap2M: 4128768 kB
DirectMap1G: 13631488 kB
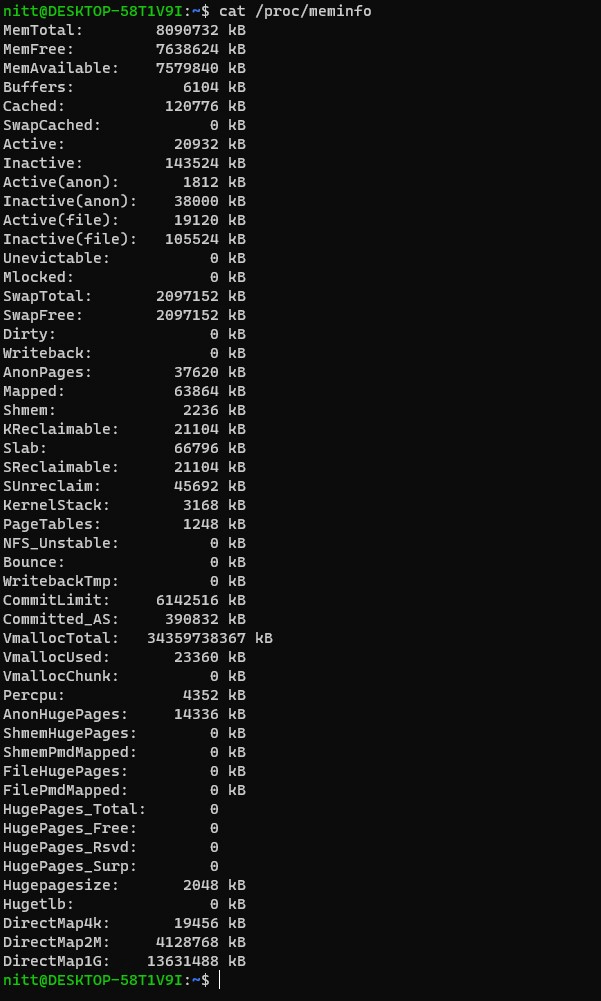
As you can notice, the /proc/meminfo lists all the processes, buffers, and shared memory usage in kilobytes. The MemTotal is the total memory of your system. The MemFree, on the other hand, lists free memory. You'll also see MemAvailiable, which is similar to MemFree. It lets you know how much memory is available for new processes.
The other values are as below:
-
Buffers: The amount of memory used by buffers.
-
Cached: The amount of memory used as cache memory.
-
SwapTotal: The total amount of swap memory.
-
SwapFree: The available swap memory.
If you want to know more about /proc/meminfo values, read this: Explanation of /proc/meminfo values.
You can also use the following commands to show fewer values.
copyless /proc/meminfo
copymore /proc/meminfo
free Command to see free and used memory in Linux
The free Command is a neat way to learn about your system's physical and swap memory status. It lists the total, used, and free memory usage, alongside shared and buff/cache values. Lastly, it also lists available memory.
To run the Command, type the following in the terminal.
copyfree
By default, it'll show the values in Kilobytes. If you need the output in Megabytes(MB), use the -m flag.
copyfree -m
The output is:
total used free shared buff/cache available
Mem: 7901 303 7452 2 145 7395
Swap: 2048 0 2048
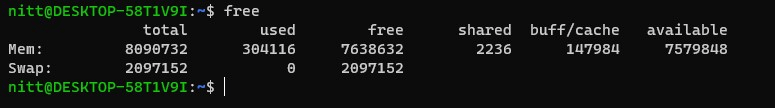
Understanding the free Command displays information is accessible. Under the entire tab, you'll see the Mem and Swap values. Similarly, it also lists the used and free values. Let's list them below.
-
Total: Shows the system's total RAM. In our case, it is 7901 MB.
-
Used: Shows the system's used RAM. In our case, it is 303 MB.
-
Free: Shows the system's free memory. In our case, it is 7452 MB.
-
Shared: Here, you'll find the memory usage by the tmpfs file system.
-
Buff/cache: It lists the memory used by the buffer and cache.
-
Available: System's available memory for new apps. In other words, any app can use the available memory without relying on swap memory.
The Memory column list all the above information. As for Swap, you only get Total, Used, and Free values.
Lastly, if you want to display it in line, then you need to use the following Command.
copyfree -t -m
vmstat Command to Report Virtual Memory Statistics in Linux system
If you only want to learn about virtual memory statistics, use the vmstat Command. The command syntax is:
copyvmstat
It reports virtual memory statistics, including processes, paging, block device, memory, traps, disks, and CPU.
However, its output is not easy to read. You'll get the following output if you type vmstat in the terminal.
#output
procs -----------memory---------- ---swap-- -----io---- -system-- ------cpu-----
 r b swpd free buff cache si so bi bo in cs us sy id wa st
 0 0 0 7631484 5912 142568 0 0 1 0 1 19 0 0 100 0 0
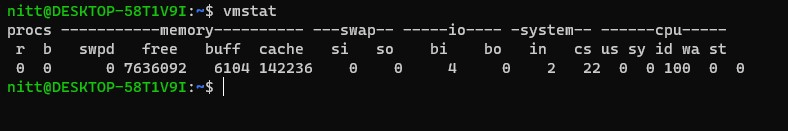
As you can see, the output is not clear. To circumvent it, you can use the -s switch flag. It forces the vmstat Command to show values in a single column. This makes it easy to read.
copyvmstat -s
#output
 8090732 K total memory
 310728 K used memory
 22340 K active memory
 144956 K inactive memory
 7631484 K free memory
 5912 K buffer memory
 142608 K swap cache
 2097152 K total swap
 0 K used swap
 2097152 K free swap
 299 non-nice user cpu ticks
 0 nice user cpu ticks
 581 system cpu ticks
 8080176 idle cpu ticks
 51 IO-wait cpu ticks
 0 IRQ cpu ticks
 24 softirq cpu ticks
 0 stolen cpu ticks
 84626 pages paged in
 972 pages paged out
 0 pages swapped in
 0 pages swapped out
 42773 interrupts
 1555675 CPU context switches
 1677583195 boot time
 334 forks
With vmstat, you can check memory usage on Linux and learn about different system summaries. That's why vmstat is more of a system monitor tool that offers more than just checking RAM usage.
Some of its unique options include:
-
- a Active: It lets you discover the system's active and inactive memory.
-
- f : It lists the number of times the system has been forked since boot.
-
-d : Use it to show disk space and other disk statistics
In short, you can use vmstat to learn about procs, swap space, operating system's IO, interrupts, and context switches. Additionally, you can learn about CPU usage, including time running kernel code, non-kernel code, idle time spent, and much more.
top Command to Check Memory Use
The top Command is another useful command to check memory usage in the Linux operating system. It provides a detailed system summary that offers access to memory and CPU usage.
The syntax of the top Command is as below.
top
When you run the top Command, it offers access to the following information:
-
memory/ swap system processes
-
number of users logged in
-
Average load on the system
-
System's uptime
-
Number of tasks running processes
-
The number of CPUs utilization
And the output for the top Command to check memory usage is as below:
top - 19:47:24 up 27 min, 0 users, load average: 0.00, 0.00, 0.00
Tasks: 6 total, 1 running, 5 sleeping, 0 stopped, 0 zombie
%Cpu(s): 0.0 us, 0.0 sy, 0.0 ni,100.0 id, 0.0 wa, 0.0 hi, 0.0 si, 0.0 st
MiB Mem : 7901.1 total, 7459.8 free, 296.8 used, 144.5 buff/cache
MiB Swap: 2048.0 total, 2048.0 free, 0.0 used. 7402.4 avail Mem
 PID USER PR NI VIRT RES SHR S %CPU %MEM TIME+ COMMAND
 1 root 20 0 2296 1608 1516 S 0.0 0.0 0:00.00 init(Ubuntu)
 4 root 20 0 2296 4 0 S 0.0 0.0 0:00.00 init
 7 root 20 0 2300 100 0 S 0.0 0.0 0:00.00 SessionLeader
 8 root 20 0 2316 104 0 S 0.0 0.0 0:00.00 Relay(9)
 9 nitt 20 0 6080 5044 3324 S 0.0 0.1 0:00.02 bash
 22 nitt 20 0 7792 3616 3032 R 0.0 0.0 0:00.01 top
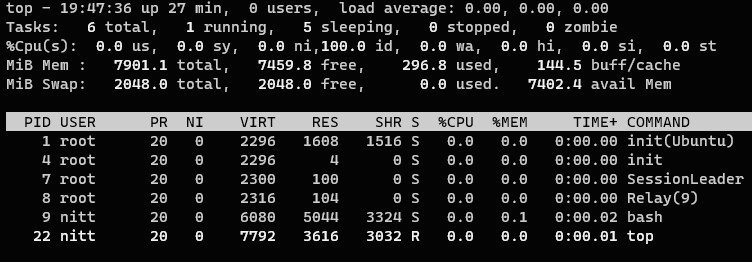
The top Command offers customizability through user-specified criteria. This makes it interactive, and it also updates periodically. So, if you need to check memory usage in real-time, you can use the top Command.
It starts with CPU information, followed by memory usage. At the bottom, it has a processes tab that lists processes individually. Furthermore, each process has its details listed, including:
-
PID (Process ID),
-
User,
-
PR (Process Priority),
-
NI (Nice Value),
-
VIRT (virtual memory used by process),
-
RES (Physical RAM usage by that particular process),
-
SHR (Shared RAM usage by that particular process),
-
%CPU (shows the CPU usage for the process),
-
$MEM (shows the memory usage for the process),
-
TIME+ (CPU Time listed in hundredths of a second),
-
COMMAND (list the command name that started the process
htop Command to Find the Memory Load of Each Process
htop Command is an evolution of the top Command. It offers better controls and a user-friendly environment for the users.
The syntax of the Command is:
copyhtop
As soon as you input it, the following visual representation will pop up:
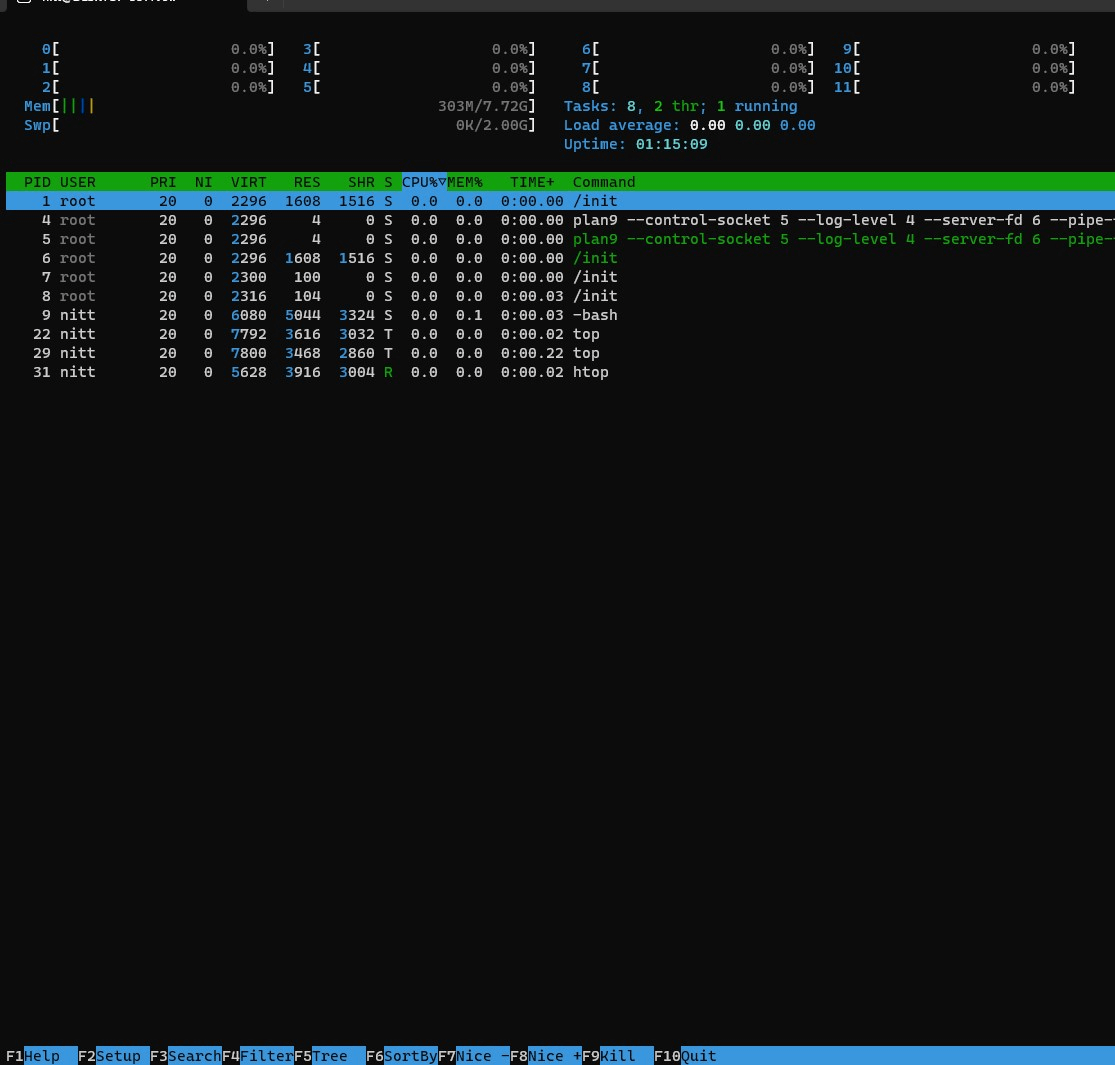
Like the top Command, the htop command updates in real-time. It has three main segments. The first segment visually provides valuable data, including installed RAM, amount of memory left, number of tasks running, average load, and uptime.
In the 2nd segment, you'll notice all process-related data. Unlike the top Command, you can perform actions on each process here.
The bottom(3rd section) is where you'll find all the available options, such as Setup(F2), Search(F3), F5(Tree), and so on.
It doesn't come pre-installed in many systems as it is newer than the top Command. To install it, run the following Command:
copysudo apt install htop
sudo apt-get install htop
Bonus: GNOME Desktop: GUI tool to see memory usage
Linux systems are created to work with a command line interface. However, if you dislike working with the command line output, you can always use a GUI tool such as GNOME desktop to check memory usage.
To do so, you need to run the following prompt in the command line:
copygnome-system-monitor
If the Command doesn't work, you must install it.
copysudo apt install gnome-system-monitor
You can access it by going to system> Administrator > System Monitor.
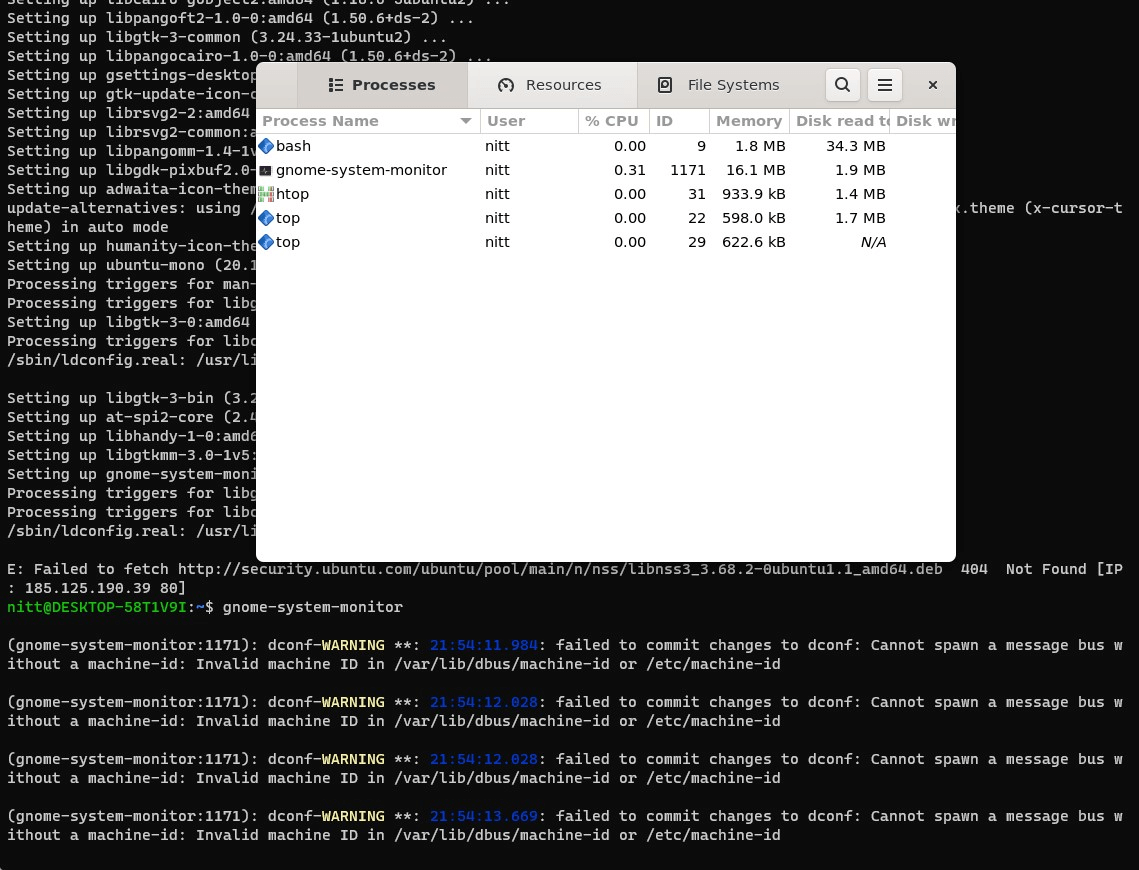
As you can see that the window has three tabs: Processes tab, Resources tab, and File Systems tab. You can switch between each tab to learn about them.
Conclusion
This leads us to the end of our five commands to check memory in the Linux system. We covered five commands: cat, htop, vmstat, top, and free Command. You can use any of them to see the Linux system's memory usage. However, learning how to interpret these commands' output is critical. It enables you to troubleshoot memory issues, especially if you're a developer or a sysadmin.

Nitish S (Twitter @nitish0099) is a C1 Advanced (CEFR) certified writer with a Master's Degree in Computer Science (B Level from NIELIT, India) and seven years of experience writing for the web covering a wide range of topics. His expertise breaks complex subjects into digestible forms for informed and uninformed audiences. Nitish has been praised for his responsiveness, responsibility, creativity, research, and timely delivery by clients such as DAML, ConsenSys, 101Blockchains.com, EducationEcosystem, Technadu, IndexWP, GeekFlare.com, Unlaunch, Conversio, Astroverse[NFT], CyberNews, MassivePeak, JoomUnited, and Alpha Serve.
Frequently Asked Questions
What is memory usage in Linux?
To function, Linux uses memory to run kernel and user processes. Without memory, the Linux operating system will not work.
How do I check my memory in the terminal?
To check memory usage in the terminal, you can use any of these commands: free, top, htop, vmstat, and "cat /proc/meminfo".
How do I see RAM usage on Linux?
The best way to check RAM usage on Linux is to use the top or htop Command. They offer detailed information about RAM usage.
What is the Linux command for memory size?
To determine how much memory your Linux system has, you need to run "cat /proc/meminfo" command.
.png)
 (1).png)

.png)