How to Check CPU Usage in Linux

As a Linux system administrator or simple Linux user, it's crucial to monitor your system's resources effectively, especially the CPU (i.e., check Linux CPU usage). This information can help you identify performance bottlenecks, optimize your operating system, and decide when to upgrade hardware.
17 Command Line Tools to Check CPU Usage in Linux
In this article, we'll introduce 17 command line tools that you can use to check CPU usage in Linux and address any other relevant questions in a handy FAQ section. To use the following commands, open the terminal, add them, and hit them. Simple.
-
- 17 Command Line Tools to Check CPU Usage in Linux
- How Do I Check My Top 10 CPU Usage Linux?
- How to Check CPU Usage Percentage in Linux?
- How Do I See Average CPU Usage in Linux?
- What Is the Most Basic Linux Command?
- How to Find Out Who Is Monopolizing or Eating the CPUs in Linux?
- What Is the Command to Check Linux CPU Usage?
1. top
This is one of the most widely used tools for monitoring CPU usage in Linux. It provides real-time information about system resource usage, including the CPU. The output shows a list of processes running on the system, sorted by the average CPU usage.
2. htop
A user-friendly alternative to the top command that provides an interactive, real-time view of system processes, including CPU usage, memory usage, and system processes. It allows users to sort and filter processes, send signals to processes, and monitor performance using color-coded visualizations. Its customizable interface and ease of use make it a popular alternative to the standard top command.
3. mpstat
This tool provides detailed information on CPU usage, including the percentage of CPU time spent in different modes, such as user mode, system mode, idle time, idle processes, and input/output (I/O) wait. It’s also best used to provide information on CPU usage for multiple cores and processors.
4. ps
This tool provides information on the system's current processes, including CPU usage. The output can be used to identify which processes consume the most CPU resources and memory usage and process IDs (PIDs), among others.
5. uptime
Use the uptime command to find information on how long the system has been running and the average system load over the past 1, 5, and 15 minutes. It can monitor system uptime and identify periods of high system load. uptime is a simple yet valuable tool for system monitoring.
6. vmstat
This provides information on system resource usage, including CPU usage. It can also be used to identify potential performance bottlenecks and diagnose issues related to memory usage. On top of this, this vmstat helps you view swap space and page I/O.
7. sar
A Linux command that provides historical performance data on various system processes. This versatile performance monitoring tool provides information on various system resources, including the CPU.
8. iostat
This command can monitor system input/output (I/O) performance. It provides information on disk usage, I/O operations per second, and data transfer rates. iostat can diagnose disk I/O issues, optimize system resource allocation, and display CPU usage.

9. pidstat
A Linux command that offers a detailed view of resource usage for specific processes. Like the previous commands, it can also monitor CPU usage, memory usage, and disk I/O for individual processes. pidstat is a really useful tool for identifying processes that are consuming too many system processes and can be used to optimize system performance. It offers information on specific processes, including their CPU usage and user processes, among others.
10. dstat
It provides a real-time view of your system and running processes and is a powerful tool that can help to diagnose performance issues and optimize system resource allocation. In other words, the dstat command helps you display CPU usage, user processes, idle processes, and various other CPU statistics.
11. atop
The atop command provides a detailed view of your system and running processes. Use it to monitor various system resources, including CPU, memory, disk I/O, and network file system utilization. atop provides real-time performance monitoring and can record system activity for later analysis. It is a versatile tool that can diagnose performance issues, optimize system resource allocation, and check running processes.
12. nmon
Also known as Nigel's performance Monitor, the non-command is a tool that can be used to monitor various system resources, including CPU, memory, disk I/O, and network utilization. nmon provides a detailed view of your computer and can be used to diagnose performance issues and optimize system resource allocation and user processes. It is a popular tool among system administrators for managing and monitoring computers adopting the Linux kernel.
13. glogg
The glogg command is used to search and analyze log files. It provides a graphical interface that allows users to search through log files quickly and efficiently. glogg can highlight necessary log entries and filter out unwanted information, making it an essential tool for troubleshooting computer issues.
14. iftop
This command is used to monitor network traffic in real-time. It lists the current network connections and their corresponding bandwidth usage. iftop can help to identify which processes are generating the most network traffic and can be used to troubleshoot network performance issues.
15. sysstat
The sysstat is a Linux command that provides a collection of performance monitoring tools for the system. It includes commands like sar, mpstat, and iostat, which can be used to gather information about system resource utilization, such as CPU, memory, and disk usage. sysstat provides a comprehensive view of Linux processes and can be used to diagnose performance issues and optimize system resource allocation.
16. cpulimit
A Linux kernel command is used to limit a process's CPU usage and reduce CPU load and CPU utilization in Linux. It is a tool that can help to prevent processes from consuming too much CPU time, which can cause system performance issues. cpulimit is a simple yet effective tool that can manage the CPU usage of processes and ensure that the system remains responsive. A valuable tool for managing resource utilization on your system.
17. cgroups
This is a Linux command that stands for control groups. It is used to manage allocating system processes such as CPU, memory, and disk I/O to groups of processes. cgroups allow system administrators to set limits and priorities for resource usage to ensure critical processes receive the necessary resources.
These are just a few command line tools available for monitoring and checking CPU usage in Linux. As expected, each tool has its strengths and weaknesses, so you should choose the one that best fits your needs. In every case, whether you're troubleshooting performance issues, optimizing system performance, or monitoring resource utilization, these commands will help you get the information you need to make informed decisions.
We have explored a variety of commands that can be used to monitor your CPU’s performance on Linux and decrease CPU load. In general, it is recommended to understand each well before using it. It is also important to note that using these tools can consume CPU resources, with some commands consuming more than others. Hence, when using any of these tools, do consider their CPU usage.
Ultimately, combining these commands will help you identify which processes consume excessive CPU time, whether there is sufficient free memory, and whether any processes are stalled due to I/O wait for time on the network or disk access.
How Do I Check My Top 10 CPU Usage Linux?
To check your top 10 CPU usage on Linux, you must use the top command in the terminal. It provides a real-time view of the processes running on your system, including the amount of CPU and memory each process consumes each second.
To use it, open a terminal window and type top. You will see a list of the processes running on your system, sorted by CPU usage. The process using the most CPU will be listed at the top. You can also press the Shift + m keys to sort the processes by memory usage instead of CPU usage. It’s up to you!
You can also use the ps command to get a snapshot of the processes and their CPU usage. For example, the following command will show the top 10 processes sorted by CPU usage:
ps -eo pcpu,pid,user,args | sort -k 1 -r | head -10
Moreover, the htop command is another tool that provides a more user-friendly interface for monitoring processes and system resource usage on Linux. It provides a real-time view of the processes, including their CPU usage, CPU performance, memory usage, and other information.
Therefore, by using these tools, you can better understand which processes are consuming the most resources on your Linux system and take appropriate action if necessary.
How to Check CPU Usage Percentage in Linux?
If you want to check the CPU usage percentage in Linux, know it's not hard. On the contrary, there are several commands that you can use. Here are some of the most popular ones.
-
top Command: This real-time process monitoring tool provides a detailed view of the system's resource usage. To launch it, open a terminal and type top. The first line of the output shows the total CPU usage percentage, along with the utilization of individual CPU cores.
-
mpstat Command: The mpstat command is part of the sysstat package and provides a detailed view of CPU utilization, including the percentage of CPU time spent in user mode, system mode, idle, and I/O wait. To use the mpstat command, you can type mpstat in the terminal and hit enter.
-
iostat Command: The iostat command is part of the sysstat package and provides information on CPU utilization, disk I/O, and network I/O. To see the CPU utilization, type iostat in the terminal and hit enter. The output will show the average CPU utilization over a specified interval.
-
htop Command: This is a more user-friendly alternative to the top command, providing a real-time view of the processes and their resource usage. To use it, simply type htop in the terminal and hit it. The CPU usage percentage will be displayed at the top of your screen. So, it's hard to miss.
-
vmstat Command: The vmstat command provides information on system resources and process-related statistics, including CPU utilization. To use the vmstat command, type vmstat in the terminal and hit enter. The output will show the CPU utilization in system mode, user mode, and idle time.
Using any of these commands, you can quickly check the CPU usage percentage on your Linux system and CPU load and determine whether your system is running efficiently or if any processes are consuming excessive resources.
How Do I See Average CPU Usage in Linux?
You can use several command line tools to see CPU usage on Linux. Here are a few of the most commonly used ones:
-
top Command: This command provides a real-time view of the system's resource usage, including CPU utilization. To launch it, open a terminal and type top. The first line of the output shows the total CPU utilization, along with the utilization of individual CPU cores.
-
htop Command: The htop command is a more user-friendly alternative to the top command, providing a real-time view of processor usage. To use the htop command, type htop in the terminal and hit enter. The CPU usage is displayed at the top of the screen.
-
mpstat Command: The mpstat command is part of the sysstat package and provides detailed information on CPU utilization, including the percentage of CPU time spent in user mode, system mode, time spent waiting, and I/O wait. Once again, to use the mpstat command, type mpstat in the terminal and hit enter. That's all it takes.
When you use any of these commands, you quickly see the CPU usage on your computer (or virtual machine), which enables you to determine whether your system is running efficiently or if any processes are consuming excessive resources. In other words, using them enables to track processor usage and better understand poor system performance, and see how you can fix it.
What Is the Most Basic Linux Command?
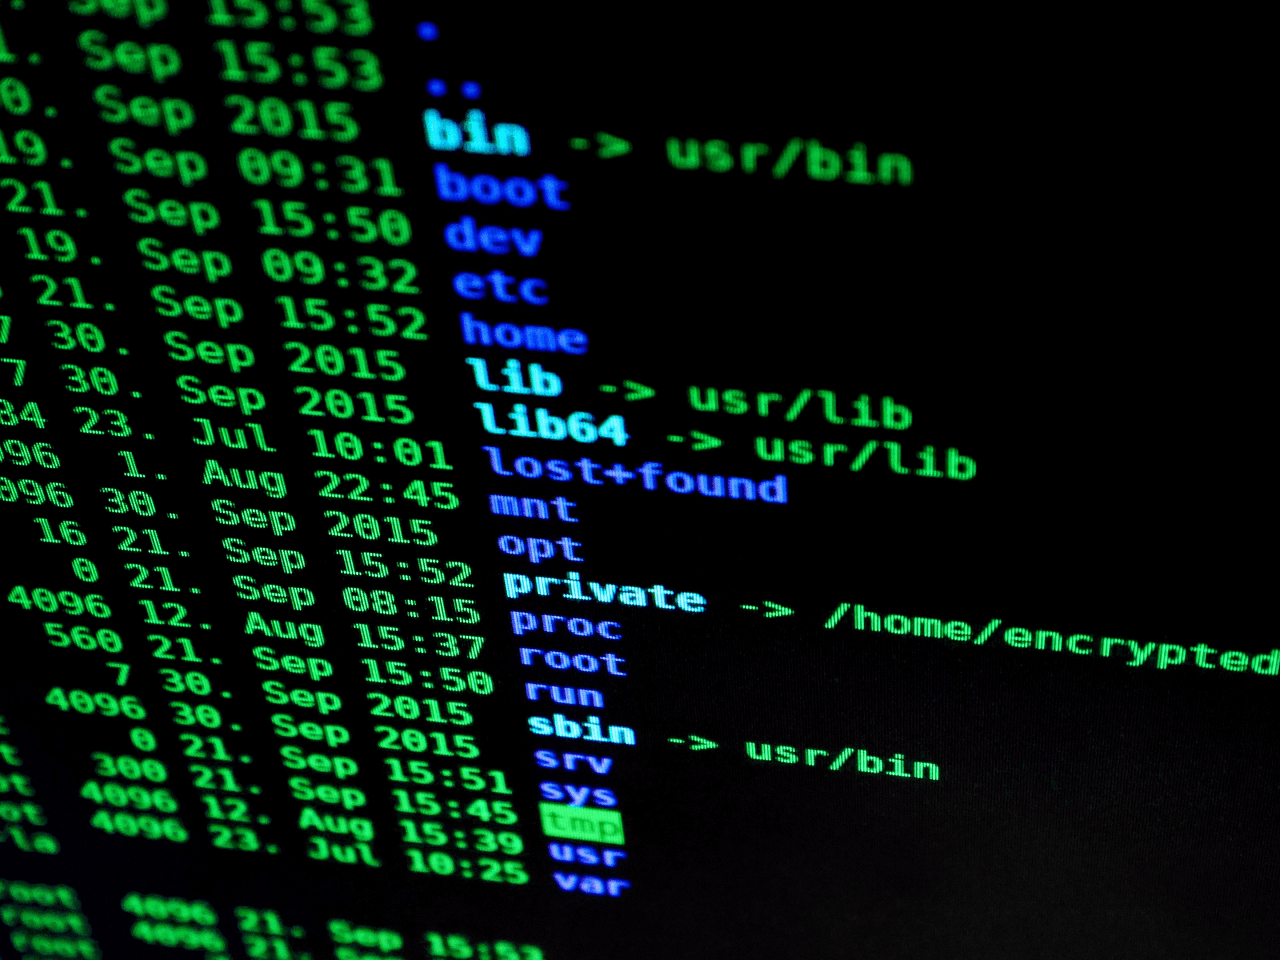
The most basic Linux command is probably the ls command, which stands for list. The ls command is used to list the contents of a directory. It displays the names, sizes, and permissions of the files and directories in the specified directory. The ls command is essential for navigating the file system and finding the files and directories you need.
When you first start using the Linux command line, it's a good idea to start with the basic commands like ls, cd (change directory), and pwd (print working directory), to name a few. These will help you get comfortable with the basic navigation and file management tasks that you will need to perform regularly when working with a Linux system.
Simple But Essential
Therefore, the ls command is simple but essential in Linux and is a good starting point for those new to the command line. With a solid understanding of the most basic Linux commands, you can explore more advanced commands and tools to make the most of your system.
How to Find Out Who Is Monopolizing or Eating the CPUs in Linux?

Finding out which process or application is monopolizing or consuming a large amount of CPU resources in Linux can be challenging, especially if you’re not an experienced Linux user. There are several tools and techniques that you can use to identify the culprit. So, let’s go over some of the most common and valuable methods.
As mentioned, the top, htop, mpstat, and atop commands are real-time system monitoring tools that provide information about system resource usage, including CPU utilization and CPU performance. You must hit any of these commands on the command line to identify which process consumes the most CPU and then take appropriate action to resolve the issue.
That said, there are more commands to see CPU usage in Linux:
-
sar Command: This command is part of the sysstat package and offers information about system resource utilization over time. You can use sar to monitor CPU usage over some time and identify trends and patterns that may help you pinpoint the process that is consuming the most CPU.
-
pidstat Command: The pidstat command is part of the sysstat package and provides information about process-level resource usage, including CPU utilization. You can use the pidstat command to monitor the CPU usage of specific processes, making it easy to identify which process monopolizes the CPU.
-
atop Command: The atop command is a system and process monitoring tool that provides detailed information about processor usage, including CPU utilization. You can use the atop command to monitor CPU usage over time and identify which process consumes the most.
After identifying the process consuming the most CPU, you can take appropriate action to resolve the issue. This includes killing the process, optimizing the application code, or tuning system settings.
Challenging But Necessary
To sum up, finding out which process or application monopolizes the CPU in Linux can be challenging. Still, as shown above, there are several commands that you can use to identify the culprit.
What Is the Command to Check Linux CPU Usage?

Although this question has been answered, it's still tricky. So, let's go over it once more:
Generally speaking, checking CPU utilization in Linux and CPU performance is a piece of cake. These are the most commonly used commands that allow you to see your CPU’s usage in Linux:
-
top Command: By far, the top command is one of the most popular in checking CPU usage, CPU performance, and general CPU monitoring. It’s a real-time process monitoring tool that provides a detailed view of the system's resource usage, including CPU utilization. To launch it, open a terminal and type top.
-
htop Command: The htop command seems to be more user-friendly than the top command and also provides a real-time view of the processes and their resource usage, as well as CPU data. To use it, type htop in the terminal and hit enter.
-
mpstat Command: As part of the sysstat package, the mpstat command provides detailed information on CPU utilization, including the percentage of CPU time spent in user mode, CPU status, system mode, time spent idle, I/O wait, and overall CPU usage. To use the mpstat command, type mpstat in the terminal. Then, hit enter.
-
ps Command: The ps command provides information on the system's current processes, including their CPU utilization. To use it to see the CPU utilization of all processes, type ps aux in the terminal and hit enter.
This is it! Use the above commands to check your system's CPU usage and performance - perfect for performance readings.
Frequently Asked Questions
What is CPU Utilization in Linux?
CPU utilization in Linux refers to the amount of CPU time the system uses and its processes at a given moment. In other words, it measures how much of the CPU's processing power is utilized.
CPU utilization can be expressed as a percentage of total CPU time, which indicates the proportion of CPU time being used versus the amount of time that the CPU is idle.
Your System Is Under Heavy Load
A high CPU utilization in Linux can indicate that the system is under heavy load, which various factors, including resource-intensive applications, many active processes, or a shortage of system memory, can cause. Conversely, low CPU utilization can indicate that the system is underutilized and could benefit from adding more processing tasks.
It's crucial to monitor CPU utilization and system processes in Linux to ensure that the system runs efficiently and identify any performance bottlenecks. When you use commands like top, htop, and mpstat, you can quickly check the CPU utilization on your system and determine whether your system is running smoothly or if any processes are taking too much of your system’s resources and need to end.
What Is a Linux CPU Command?
A Linux command is a utility or program that runs on the command line.
A command line is an interface that accepts lines of text and processes them into instructions/guidelines for your system. Graphical user interfaces (GUIs) are just abstractions of command-line programs built to streamline the process of using a computer and installing and using software.


