The significance of page speed to user experience is so much that Google included Page Speed as one of its ranking factors in 2018.
As per a page speed benchmark report by Google, the probability of a mobile site visitor bouncing off the page increases by 113% if the load time goes from one second to seven seconds. Thus, load speed is vital when building a Search Engine Optimised (SEO) website, whether for mobile or desktop.
Google claims that the speed of your website is indirectly proportional to its bounce rate. The chances of visitors bouncing off your web page even before it loads increase dramatically as the load time escalates.
To avoid that, Google recommends that web developers and site owners focus on user-centric performance metrics for the web pages. It emphasizes using tools like Google's PageSpeed Insights, Google Lighthouse, etc., to analyze web page performance and inculcate features that will enhance user experience.
This article covers the Google PageSpeed Insights speed test and how to utilize its features to magnify your page conversion.
-
- How Page Speed Impacts Conversions?
- PageSpeed Research by Google
- Google's PageSpeed Insights (PSI) Explains
-
How to Score High on the PageSpeed Insights Tool?
- Avoid Post-Click Landing Page Redirects
- Minify JavaScript and CSS files
- Enable Compression
- Prioritise Above-the-fold Content
- Use Browser Caching
- Minimise Request Counts and Transfer Size
- Serve Images in Next-Gen Formats
- Embed Video Content
- Speed Up Server Response Times
- Eliminate Render Blocking Resource
- Minimise Main-Thread Work
- Use Video Format for Animated Content
- Preload Key Requests
- Ensure Text Remains Visible During Webfont Load
- Implement AMP
- Avoid Chaining Critical Requests
- Appropriate SEO
- Conclusion
How Page Speed Impacts Conversions?
According to Google, 53% of mobile visitors bounce off the page if it takes over 3 seconds to load.
Google states that Page Speed is two things:
-
The time it takes to display above-the-fold content fully
-
The time it takes for a browser to render a page completely
However, the delay in loading a page can be because of several reasons, such as cellular data, poor mobile networks of users, cache accumulation, domain's web hosting service, etc.
Page Speed is affected by various uncontrollable elements, but the site owner can still optimize a few factors, such as excessive JavaScript, videos, content, etc.
Google considers the overall performance of a website when putting it up for SERP (Search Engine Results Pages). This includes all factors affecting the user's experience, including page speed.
Thus, page speed is an important SEO component that expresses your dedication to creating a high-quality user experience.
A website has an impressive conversion rate as long as it is well-optimized, dramatically including high load speed.
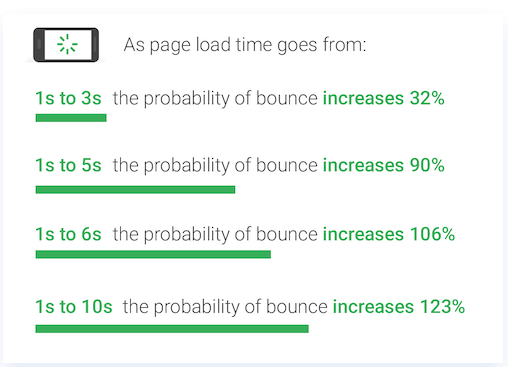
Google's research shows that if the load time increases from one to three seconds, the bounce rate increases by 32%. If the time goes up to 5 seconds, the bounce rate increases to 90%, and it even crosses 120% if the page load takes up to 10 seconds.
PageSpeed Research by Google
A Google research explains the connection between load time and conversion rate. The study shows that loading an average mobile landing page takes about 22 seconds.
It is almost seven times longer than what a typical visitor can patiently wait for, leading to 53% abandoning the page before it even opens. A website loses over half its prospects because of a lagging landing page.
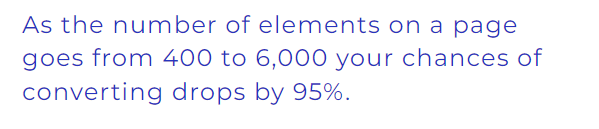
Moreover, SOASTA's machine-learning technology has helped researchers find a correlation between conversion rate, website load times, and page weight (as per the data size). If the number of elements on a page, such as images, text, etc., goes up to 6000 from basic 400, the conversion chances drop by 95%.
In simple words, a heavier page makes loading slower and conversion poorer.
Detecting the reason behind the slow loading of a page is not always direct. Although the exceeding number of images and texts are easily visible, some issues like excessive JavaScript and CSS scripts and other redirects are hard to pinpoint.
Fortunately, you can use tools like Google PageSpeed Insights to determine why load time increases.
Google's PageSpeed Insights (PSI) Explains
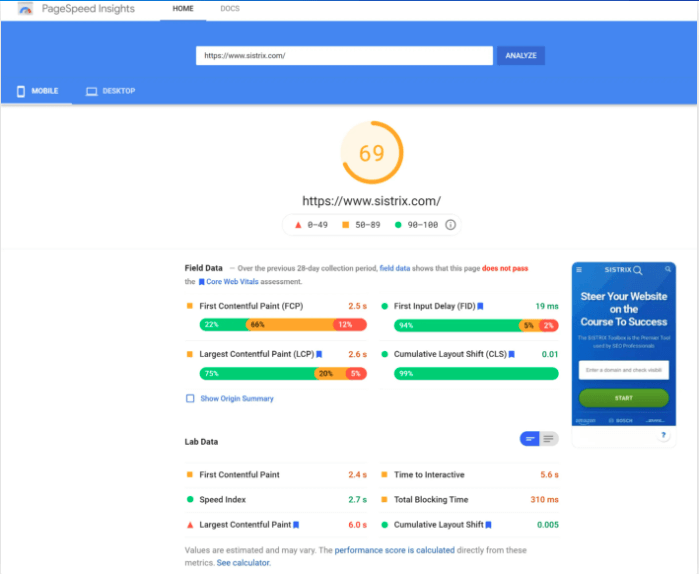
Google PageSpeed Insights is a performance analysis automated tool by Google that evaluates web page content for desktop and mobile versions of the website.
It is a speed test that measures the loading time and provides a page speed score and potential optimization recommendations. PSI shows a detailed score explaining how Google analyses the technical performance of any web page.
Pro Tip: It should be noted that only the site speed is considered a ranking factor by Google, not the Google PageSpeed Insights score. The score is just an overview estimate of the page's performance.
PSI combines lab and field data about a web page to give a combined score. Field data helps in capturing real-world data but has only limited metrics. Lab data is collected in a controlled environment, which is helpful in debugging but fails to capture authentic and concrete bottlenecks.
The scores are given on a scale of 0 to 100 for different experiences of real users calculated by CrUX. Various metrics capture the speed and time for other aspects of loading.
These metrics include Largest Contentful Paint, First Input Delay, First Contentful Paint, and Cumulative Layout Shift, commonly known as LCP, FID, FCP, and CLS. It is based on the aggregated data collected over the previous 28 days.
The scores also include experiences for experimental metrics calculated under lab data. Speed Index, Interaction to Next Paint or INP, and Time to First Byte or TTFB experiences.
Google PageSpeed Insights show a combined result, including field data collected by Chrome User Experience Report (CrUX) and lab data gathered by Google Lighthouse. You can check both mobile and desktop views by switching the respective tabs.
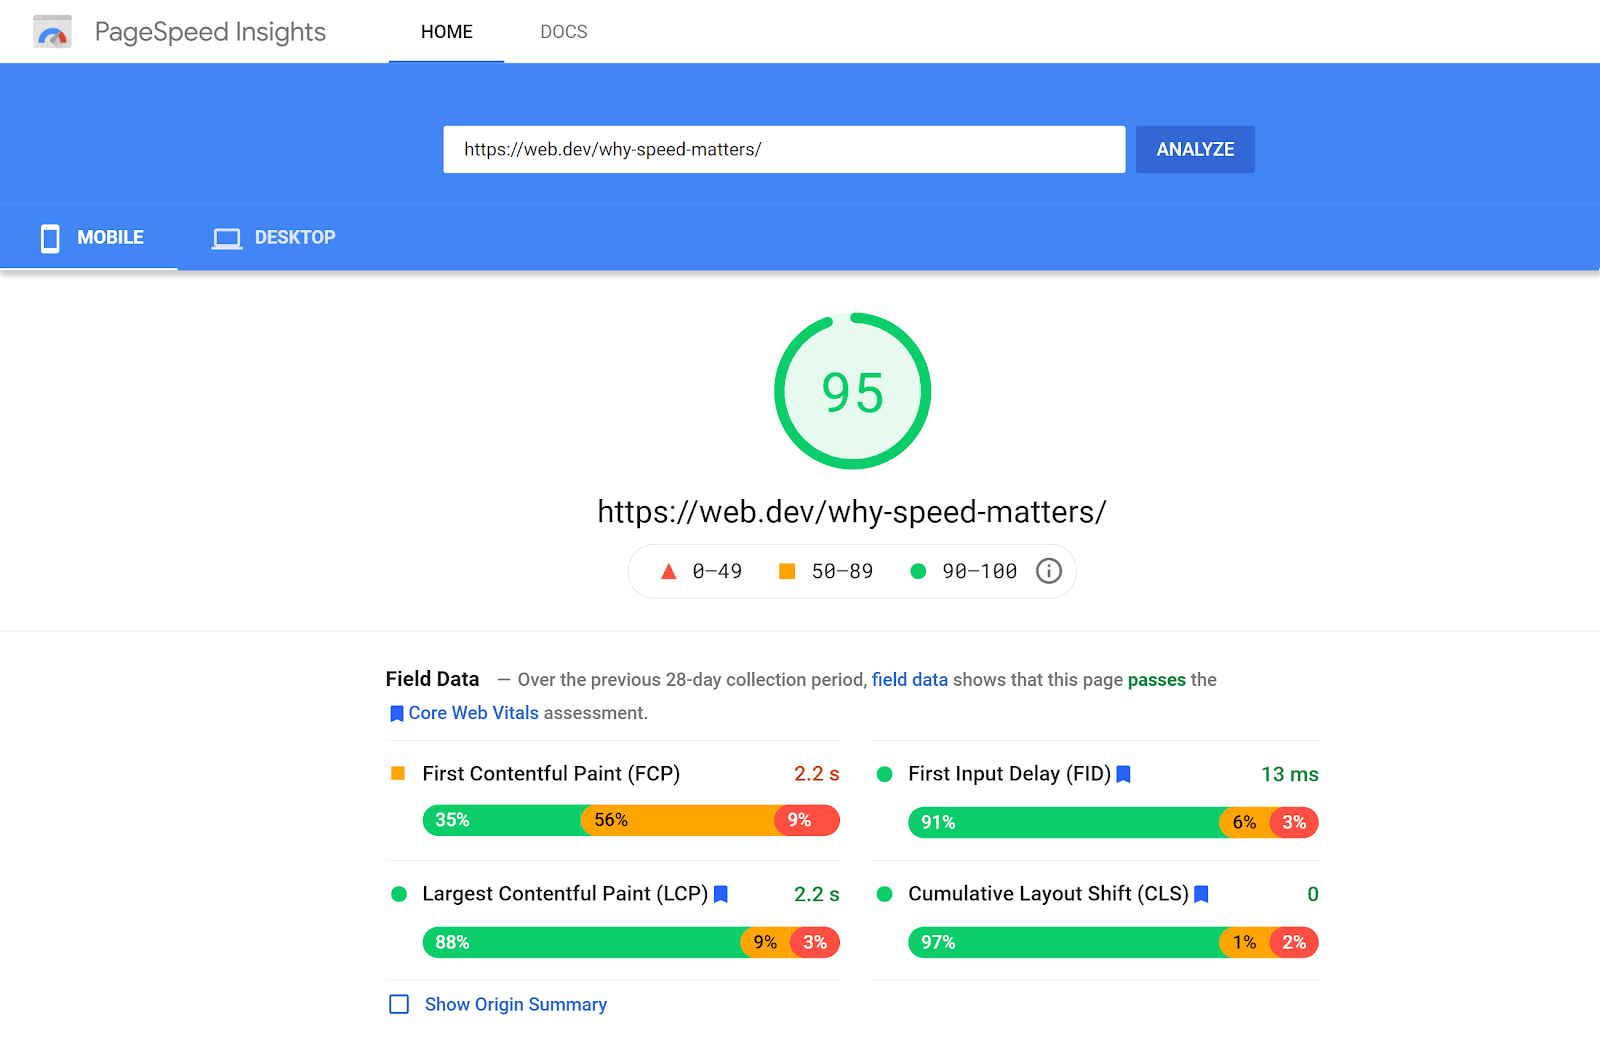
Field Data Scoring
After complete analysis, the PSI result shows Field Data first. The chrome user experience report or CrUX is the data that refers to the values of the user's FCP, FID, LCP, and CLS experience. The different factors are calculated as follows:
-
The FCP measures the time the browser takes to load the first image or render the first text. This value shows an approximate time of how long it takes for the user to interact with the website for the first time.
-
The FID value measures the response and interaction time of the page according to the user. The first input delay value is the time between the user's first click or interaction with the page and the browser's actual response to perform that.
-
The LCP measures the time taken by the browser to render the most significant element of the page. It is usually the page's main content and allows the users to use the actual content from then on.
-
Using CLS, Google estimates how much the content "jumps" while loading the page. This often happens when advertisements take longer to display or images are reloaded. It is easier for the user to absorb content when the layout stays stable and does not jump around. This is known as a cumulative layout shift.
The values in this result are divided into three different color categories, displayed according to speed:
-
Fast is shown in green. It is where the FCP lies between 0 and 1 second, FID between 0 and 0.1 seconds, LCP between 0 and 2.5 seconds, and CLS change ranges between 0 and 10 %.
-
Average performance is marked in orange. It is when FCP lies between 1 and 3 seconds, FID is between 0.1 and 0.3 seconds, LCP is between 2.5 and 4 seconds, and CLS change ranges between 10 and 25 %.
-
Slow is shown in red. Here, FCP is more than 3 seconds, FID is more than 0.3 seconds, LCP exceeds 4 seconds, and CLS change is more than 25 %.
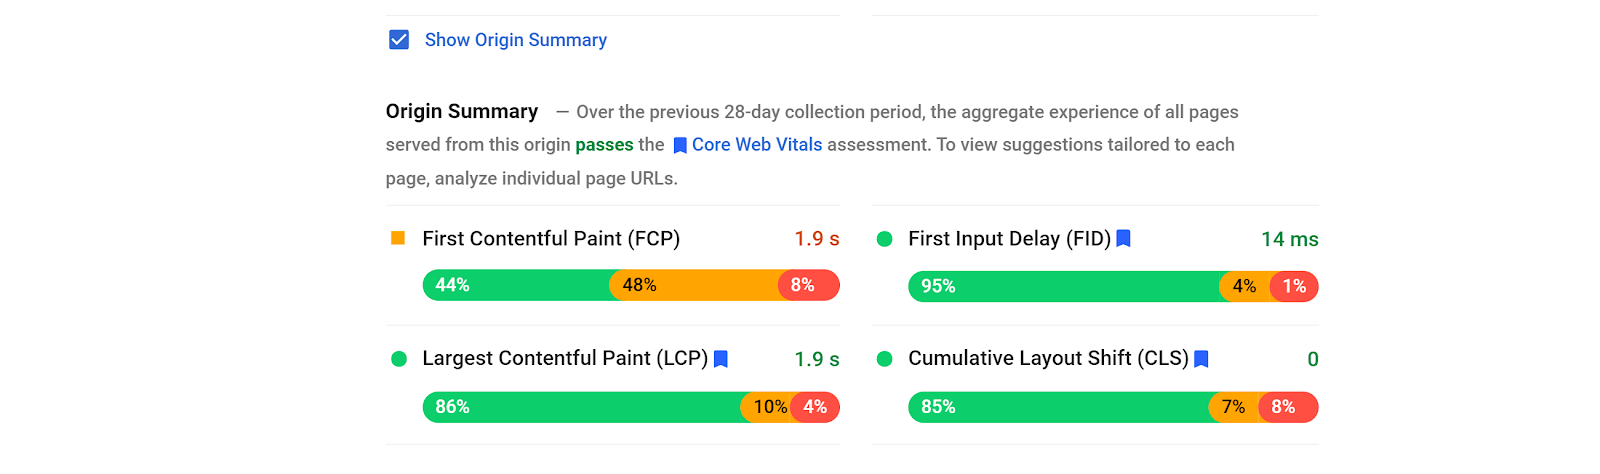
After the field data score, the page shows a "Show Origin Summary" sub-item. On clicking this, the values shown above will get displayed at the domain level rather than the URL level.
However, if the CrUX data set does not have enough data for a particular URL, Google will show that in a note and the "Origin Summary" data.
Core Web Vitals
Core Web Vitals are a mutual set of metrics assessing URL performance and user experience across different criteria. It is measured for mobile and desktop devices to get an insight into the user experience and act as a ranking factor for Google.
LCP, FID, and CLS are the three critical metrics under Core Web Vitals that are calculated for each page.
With sufficient data, the aggregation passes the Core Web Vitals assessment if all three metrics are 75% green; otherwise, it fails the evaluation. If the data is insufficient for FID, the other two must be 75% green to pass the assessment. However, the page aggregation is not assessed if the LCP or CLS data is insufficient.
Lab Data Scoring
Google PageSpeed Insights uses Lighthouse API as its Lab data analysis engine. Lab test data values are based on how the website performs in general performance best practices. Google lighthouse also evaluates and scores users' FCP, LCP, and CLS experience.
Lab data also evaluates the Speed Index, Time to Interactive or TTI, and Total Time to Block or TBT.
-
Speed Index is the time taken by the page content to appear visually while the page loads.
-
TTI is the time taken by the page to be completely interactive.
-
TBT is the total time between FCP and full-page interactivity.
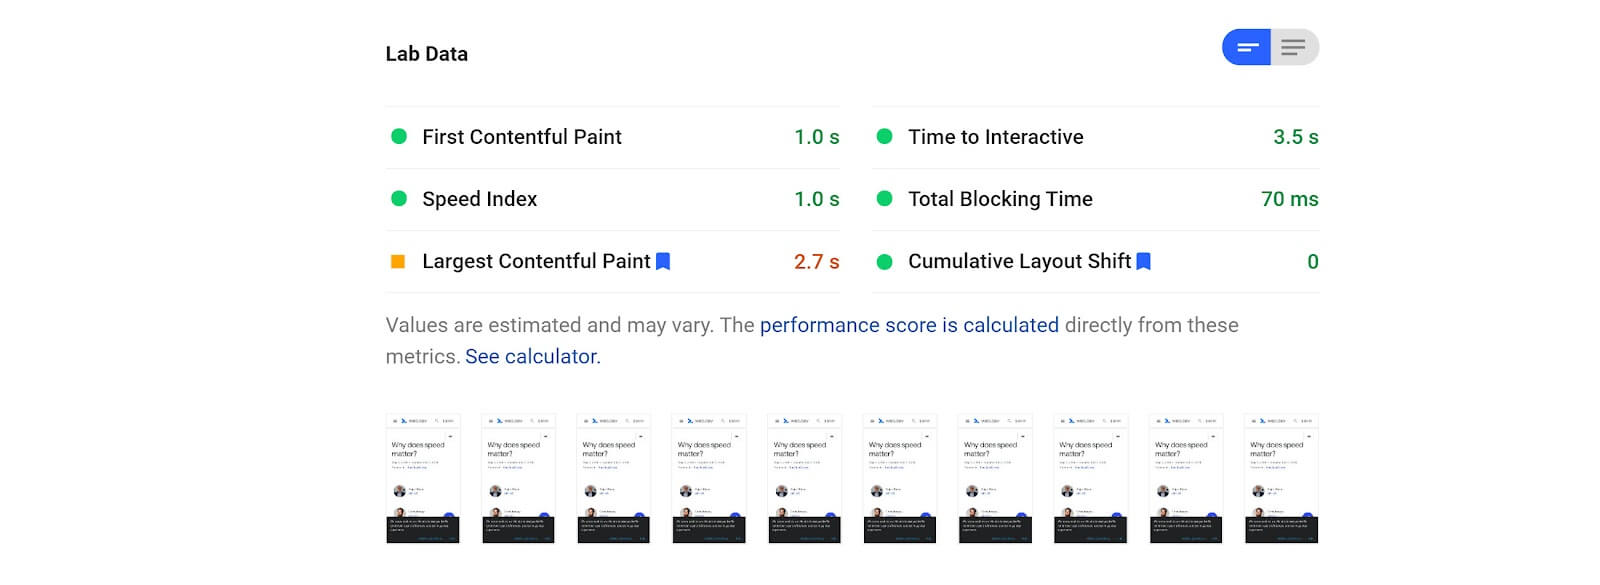
This tool also divides various Lab data metrics into Fast, Average, and Slow per their performance. Although FCP, LCP, and CLS are calculated in both analyses, the threshold is different for both tests.
-
Fast is denoted in green. In this, FCP lies between 0 and 2 seconds, Speed Index is between 0 and 4.3 seconds, LCP is between 0 and 2 seconds, TTI is between 0 and 3.8 seconds, and TBT is between 0 and 0.3 seconds. CLS change is between 0 and 10 %.
-
The average is shown in orange. Here FCP is between 2 and 4 seconds, Speed Index lies between 4.4 and 5.8 seconds, LCP is between 2 and 4 seconds, TTI is between 3.9 and 7.3 seconds, and TBT is between 0.3 and 0.6 seconds. CLS change is between 10 and 25 %.
-
Slow is denoted in red. Here FCP is more than 4 seconds, Speed Index exceeds 5.8 seconds, LCP exceeds 4 seconds, TTI exceeds 7.3 seconds, and TBT exceeds 0.6 seconds. CLS change is more than 25 %.
You may notice that sometimes the lab data varies from the field data. This is because the field data is collected from real user experience, and lab data is taken from a simulated environment with fixed network conditions.
So, the values in both categories differ as the circumstances differ in each scenario.
Pro Tip: Even if you have good lab data, it does not necessarily mean that the real user experience will also be good.
Opportunities
Once Google PageSpeed Insights has analyzed the website performance, the opportunities and diagnostics section appears. Here, the tool provides discrete recommendations or potential optimization tips that reduce loading time, thereby improving page speed.
It also shows how much time can be saved if you follow the recommendations suggested by the tool.
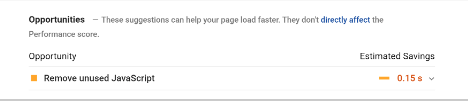
You can further check more details by clicking on the drop-down arrow next to the mentioned Opportunity in the report. It explains the issue in detail and guides measures to help fix it.
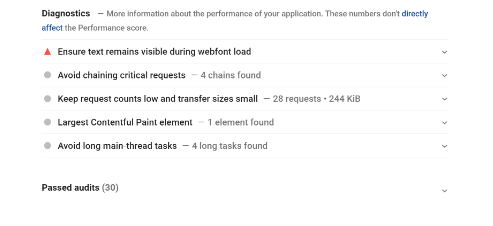
Diagnostics
Likewise, the Diagnostics section offers details about the best practices that the webpage lacks as per its analysis of the page. Here, you can get more information about the best practices and detailed data about the issue from the drop-down arrow.
Pro Tip: The information in the diagnostics section's evaluation does not directly influence the PageSpeed Insights scores. It only provides detailed information on potential issues and the best suitable solution.
Passed Audits
After thorough analysis, Google Lighthouse's report also mentions a list of things the page is doing right. This allows the site owner to understand the areas working according to PageSpeed Insights standards.
Seeing if your page analysis gets a long list of passed audits is good. It shows that your page passed the speed test and displays the best page speed practices.
How to Score High on the PageSpeed Insights Tool?
PSI score can be overwhelming to some people because of its technicalities. Nonetheless, Google is constantly concerned about its users and offers detailed suggestions for a better experience. Google’s PageSPeed Insights is a free tool that notifies the user of different load time issues in the Opportunities section, which provides action items to help recover the problems.
Apart from those suggestions, site owners can consider the following methods to minimize the loading time and get the perfect PageSpeed Insights score. These would improve the page speed but also help in enhancing the website's performance and overall appeal, making it one of the most progressive web apps.
Avoid Post-Click Landing Page Redirects
Post-click landing page redirects refer to the process where the user is redirected to a different page after clicking an ad, link, etc. It usually happens when the site owner deletes or moves a page. These redirects frustrate users and also reduce page speed.
According to Google, there are some common redirect patterns that alter the website speed and overall experience. Overall, page rendering is affected with every redirect, thereby increasing page load times. Thus, it is essential to reduce redirects to improve overall performance.
Redirects are commonly associated with web pages optimized for individual devices. Get rid of excessive redirects by building your web page with a responsive design that ensures a high-quality experience irrespective of the device.
Minify JavaScript and CSS files
Minifying is the process of removing or fixing redundant and duplicated data without altering the page’s processing by the browser. This includes eliminating futile spaces or characters and reducing the size of the CSS, HTML, or JavaScript files.
You can use various plugins to minify different browsers. Google recommends trying HTML minifier, CSSNano, WP Rocket, and Closure Compiler plugins for HTML, CSS, WordPress, and JavaScript. This help reduces the file size, which ultimately enhances the page speed.
Enable Compression
Similarly, compressing unnecessary data reduces the page burden by almost 90%. This way, the browser serves users with a smaller compressed page version that would take less time to load. This would automatically enhance your Google PageSpeed Insights performance.
Using a compressor or compression algorithm is the right way to decrease page size to a significant degree. You can reduce image size and use formats like WEBP to help with compression. You can also enable text compression recommendations to compress redundant text on the web page.
Prioritise Above-the-fold Content
Above the fold is the content visible to the user without scrolling the screen. This page must load faster so that users don’t have to wait long to see the content. Thus, prioritizing this is crucial to improve site performance.
Important content must be displayed first to quickly direct user attention toward your page's vital content. This also enables you to communicate the crux of your website right away and surge your points on Google PageSpeed Insights.
Use Browser Caching
Browser caching stores the previously loaded data in its memory to avoid reloading every time the user visits your page. This includes the footers, logos, etc. Every time the visitor opens a new page on your site, these resources don’t require reloading each time, enhancing the page load speed.
To enable browser caching, you can use various plugins. For example, you can use the WordPress plugin W3 Total Cache for those sites. It is one of the most popular caching plugins installed by over a million users. The plugin claims to amplify site performance by at least ten times and achieve a higher PageSpeed Insights score.
Minimise Request Counts and Transfer Size
If the number of requests your browser has to make to load the pages and the resources your server returns is large, it increases load times. Thus, Google recommends you minimize both aspects.
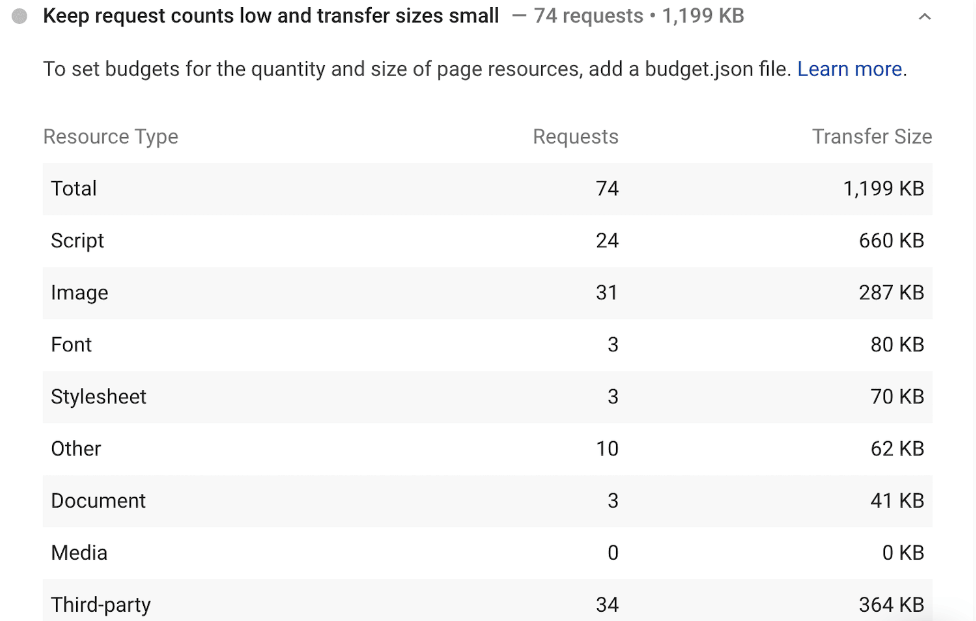
Although there is no ideal number of requests or size, Google recommends setting those as per your individual requirement by building a performance budget. It would depend on the number of external resources you call, the size of your frameworks and scripts, amount of web fonts you use, etc.
Serve Images in Next-Gen Formats
Google created images in next-gen formats such as WebP, JPEG XR, JPEG 2000, etc. These formats show high-quality characteristics and compression standards compared to earlier formats. Moreover, they load faster than commonly used image files formats like PNG and JPEG.
WebP images are gaining popularity to become the standard image format. Various plugins like Imagify and Smush offer a feature of WebP conversion. This is because WebP file sizes are almost 25-30% smaller than JPEG files without compromising the quality. In addition, it decreases the page weight by 25%, thereby reducing loading times by 3%.
Embed Video Content
Avoid uploading heavy videos on your web page that feature your products and services. Videos take up much space and stress the web server if multiple users play the video simultaneously.
Instead, you can embed video content on the page and store videos in the media library on another platform, such as YouTube. This would significantly improve the loading time of your web page.
Speed Up Server Response Times
Server response times indicate the time your server takes to start loading the page content for the user. Various reasons reduce server response times, such as Frameworks, Slow routing, Memory starvation, Database queries, Libraries, etc.
The speed of your server majorly depends on your web hosting platform. Invest in a decent web host, such as VPS Server, for a lightning-fast site speed that performs well during traffic.
Eliminate Render Blocking Resource
Static files like JavaScript, HTML, and CSS are the render-blocking resources vital in page rendering. Users are required to download these files to display the entire page. Many of these static files in the above-the-fold portion decelerate the site speed by creating a bottleneck.
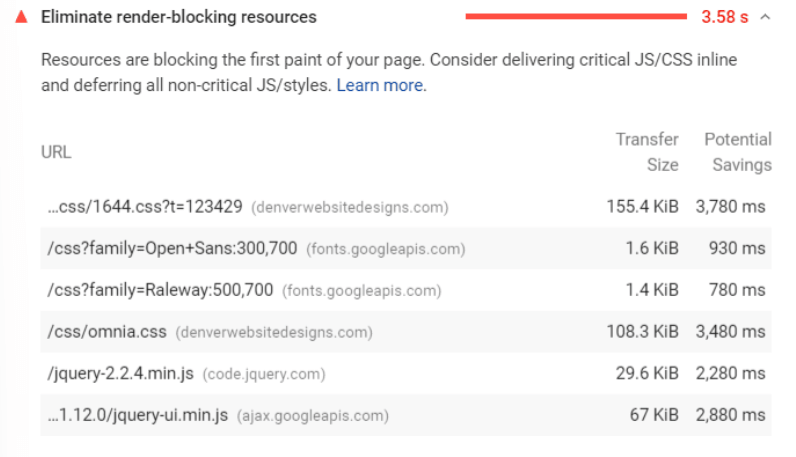
You can remove render-blocking resources using two methods
Inlining: It refers to the incorporation of JavaScript or CSS into the HTML file using a plugin. For example, Autoptimise inclines the code for WordPress sites. However, this process works only with minimal sites.
Defer and Async: In the case of large websites, you can use this method to remove render blocking. Defer attribute executes the scripts only after the HTML parsing is completed, while the async attribute executes it as soon as it is downloaded.
Minimise Main-Thread Work
Main-thread is a crucial element of a webpage. It changes the site's code into a webpage that a visitor can use. The two significant functions of the main thread include parsing and executing HTML, JavaScript, and CSS files and handling user interactions.
The main thread cannot perform both functions simultaneously. Thus, while it works on the site code, it does not handle user requests. This results in slowing page loading speed if the main thread takes longer than the usual 4 seconds.
Use Video Format for Animated Content
Some site owners prefer to put GIFs on their web pages to make the page appealing. Humorous animations, tutorial videos, and feature reviews effectively enhance the page view and make it more enjoyable for site visitors.
However, these attractive GIFs affect page performance. They take up a lot of time and data to load. Thus, Google PageSpeed Insights recommends using video content instead. You can convert GIFs into video file formats using the command line method. To do that, use tools like FFmpeg that help convert video files by entering the command line interface.
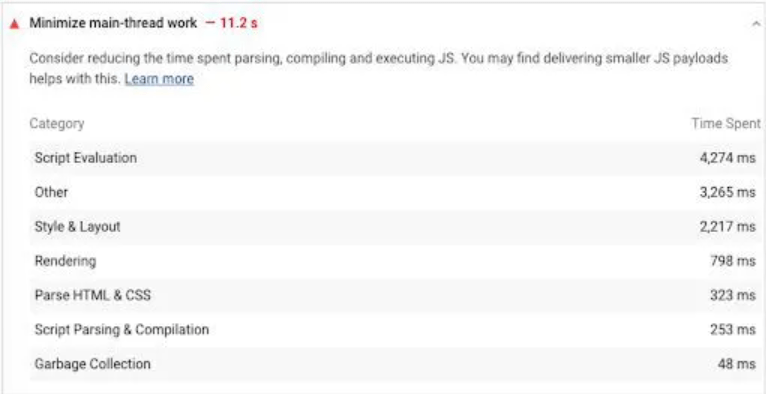
Here are a few techniques to minimize main-thread work.
-
Minify JavaScript, CSS, and HTML files using deferring or inlining to shrink file sizes.
-
Find unused JavaScript and CSS codes using tools like ChromeDevTools and remove them through inlining and deferring attributes.
-
Implement code splitting using webpack to split JavaScript into different bundles. This advanced technique removes the need to load all codes to make the webpage interactive.
-
Executing browser caching to avoid reloading every time users visit a new page.
Preload Key Requests
This suggestion enables you to reduce the number of requests browsers have to make to the site’s server. It is similar to Google's 'Preconnect to required origins' suggestion, except it does not connect to third-party assets. Instead, Preload key requests mean loading critical assets on one’s own server.
To implement this strategy, you need to edit your WordPress theme file. You can add any link tags from Google PageSpeed Insights recommendations to the header.php file. It is also possible to incorporate these link tags using other plugins like WP Rocket, Perfmatters, etc.
Ensure Text Remains Visible During Webfont Load
People usually worry about heavy images and videos. Fonts are the huge hidden files that are usually neglected when considering factors that delay the loading of a web page. Sometimes browsers hide the text until your chosen font loads completely. This results in a longer wait while the page renders.
For this purpose, Google PageSpeed Insights recommends leveraging Font Display API so that the text remains visible to users during the web fonts load.
Implement AMP
This feature is specific to mobile users. AMP stands for Accelerated Mobile Pages. Google implemented this to make mobile websites and multiple page load faster. The tool creates an open-source format that filters and removes countless irrelevant content material.
This results in faster loading of the mobile page. Moreover, it streamlines mobile users' experience by reducing clunky features that malfunction on mobile devices. AMP can be commonly found in multiple Google search results. As AMP-based articles don’t have a lot of formatting, they load faster and deliver the content quickly to the user.
Avoid Chaining Critical Requests
Chaining critical requests relate to the Critical Rendering Path or CRP. It explains how the browsers load a web page. Elements like JavaScript and CSS must load completely to make the page fully visible.
Google PageSpeed Insights tool shows a list of request chains for the analyzed page. The list consists of several dependent requests along with resource sizes. You must fulfill these requests before the page is visible. The ideal step is to minimize the amount and size of requests by following various methods, including minification, deferring, eliminating render-blocking resources, etc.
In addition, you can attempt to shorten the CRP by optimizing the sequence in which page asset loads. For this, move the above-the-fold content to the HTML file’s top. However, the Google PageSpeed Insights tool does not set any specific number of critical request chains or audit this as ‘pass’ or ‘fail’. It simply suggests the change to help enhance the loading time of your web page.
Appropriate SEO
SEO and keyword rankings are vital components of any website. It is also an essential factor in the Google PageSpeed scores. It is crucial to optimize the web content for Google crawlers so they can easily understand and index it properly.
Any startup needs a proper hold and understanding of how its SEO relates to the respective business. They also need to keep up with the SEO best practices to stay up to date. VPS Server offers access to a secure server environment that would give startups a headstart on the process.
Conclusion
A website aims to grab the attention of its users and intends to hold them on the site for longer. Having high conversion rates is an essential element for any business. But it all goes in vain if your web page does not load on time. A user has the patience of only a few seconds to wait for a page to show its contents, which is when you have to hold them.
Google PageSpeed Insights tool helps you upgrade your website speed and performance. The speed test tool enables the user to understand the problems causing site loads delay. It scores your web page and clearly shows you where it stands.
Moreover, the tool suggests recommendations to help you enhance page speed. Google understands the link between page load speed and conversions and thus offers several fixes to make your website more user-friendly and convenient.

Kavita Verma is an experienced content writer with over 10 years of experience in the field. She has worked with several tech companies, including Unisoft Technologies, NIIT, and Infotech, and has written extensively on a variety of technical topics.
Frequently Asked Questions
How can I improve my website’s score on Google PageSpeed Insight?
To improve your website's score on Google PageSpeed Insight, you should optimize your website's assets such as images, CSS, and JavaScript files, minifying code, reducing server response time, and utilizing browser caching. Also you need a fast host like VPSServer.com to improve your performance.
I am using VPSServer for hosting my website, do I get any extra support for optimizing my site?
No, VPSServer does not offer additional support for optimizing your website with their integrated Google PageSpeed Insight feature. Their team of experts can help you optimize your VPS server performance.